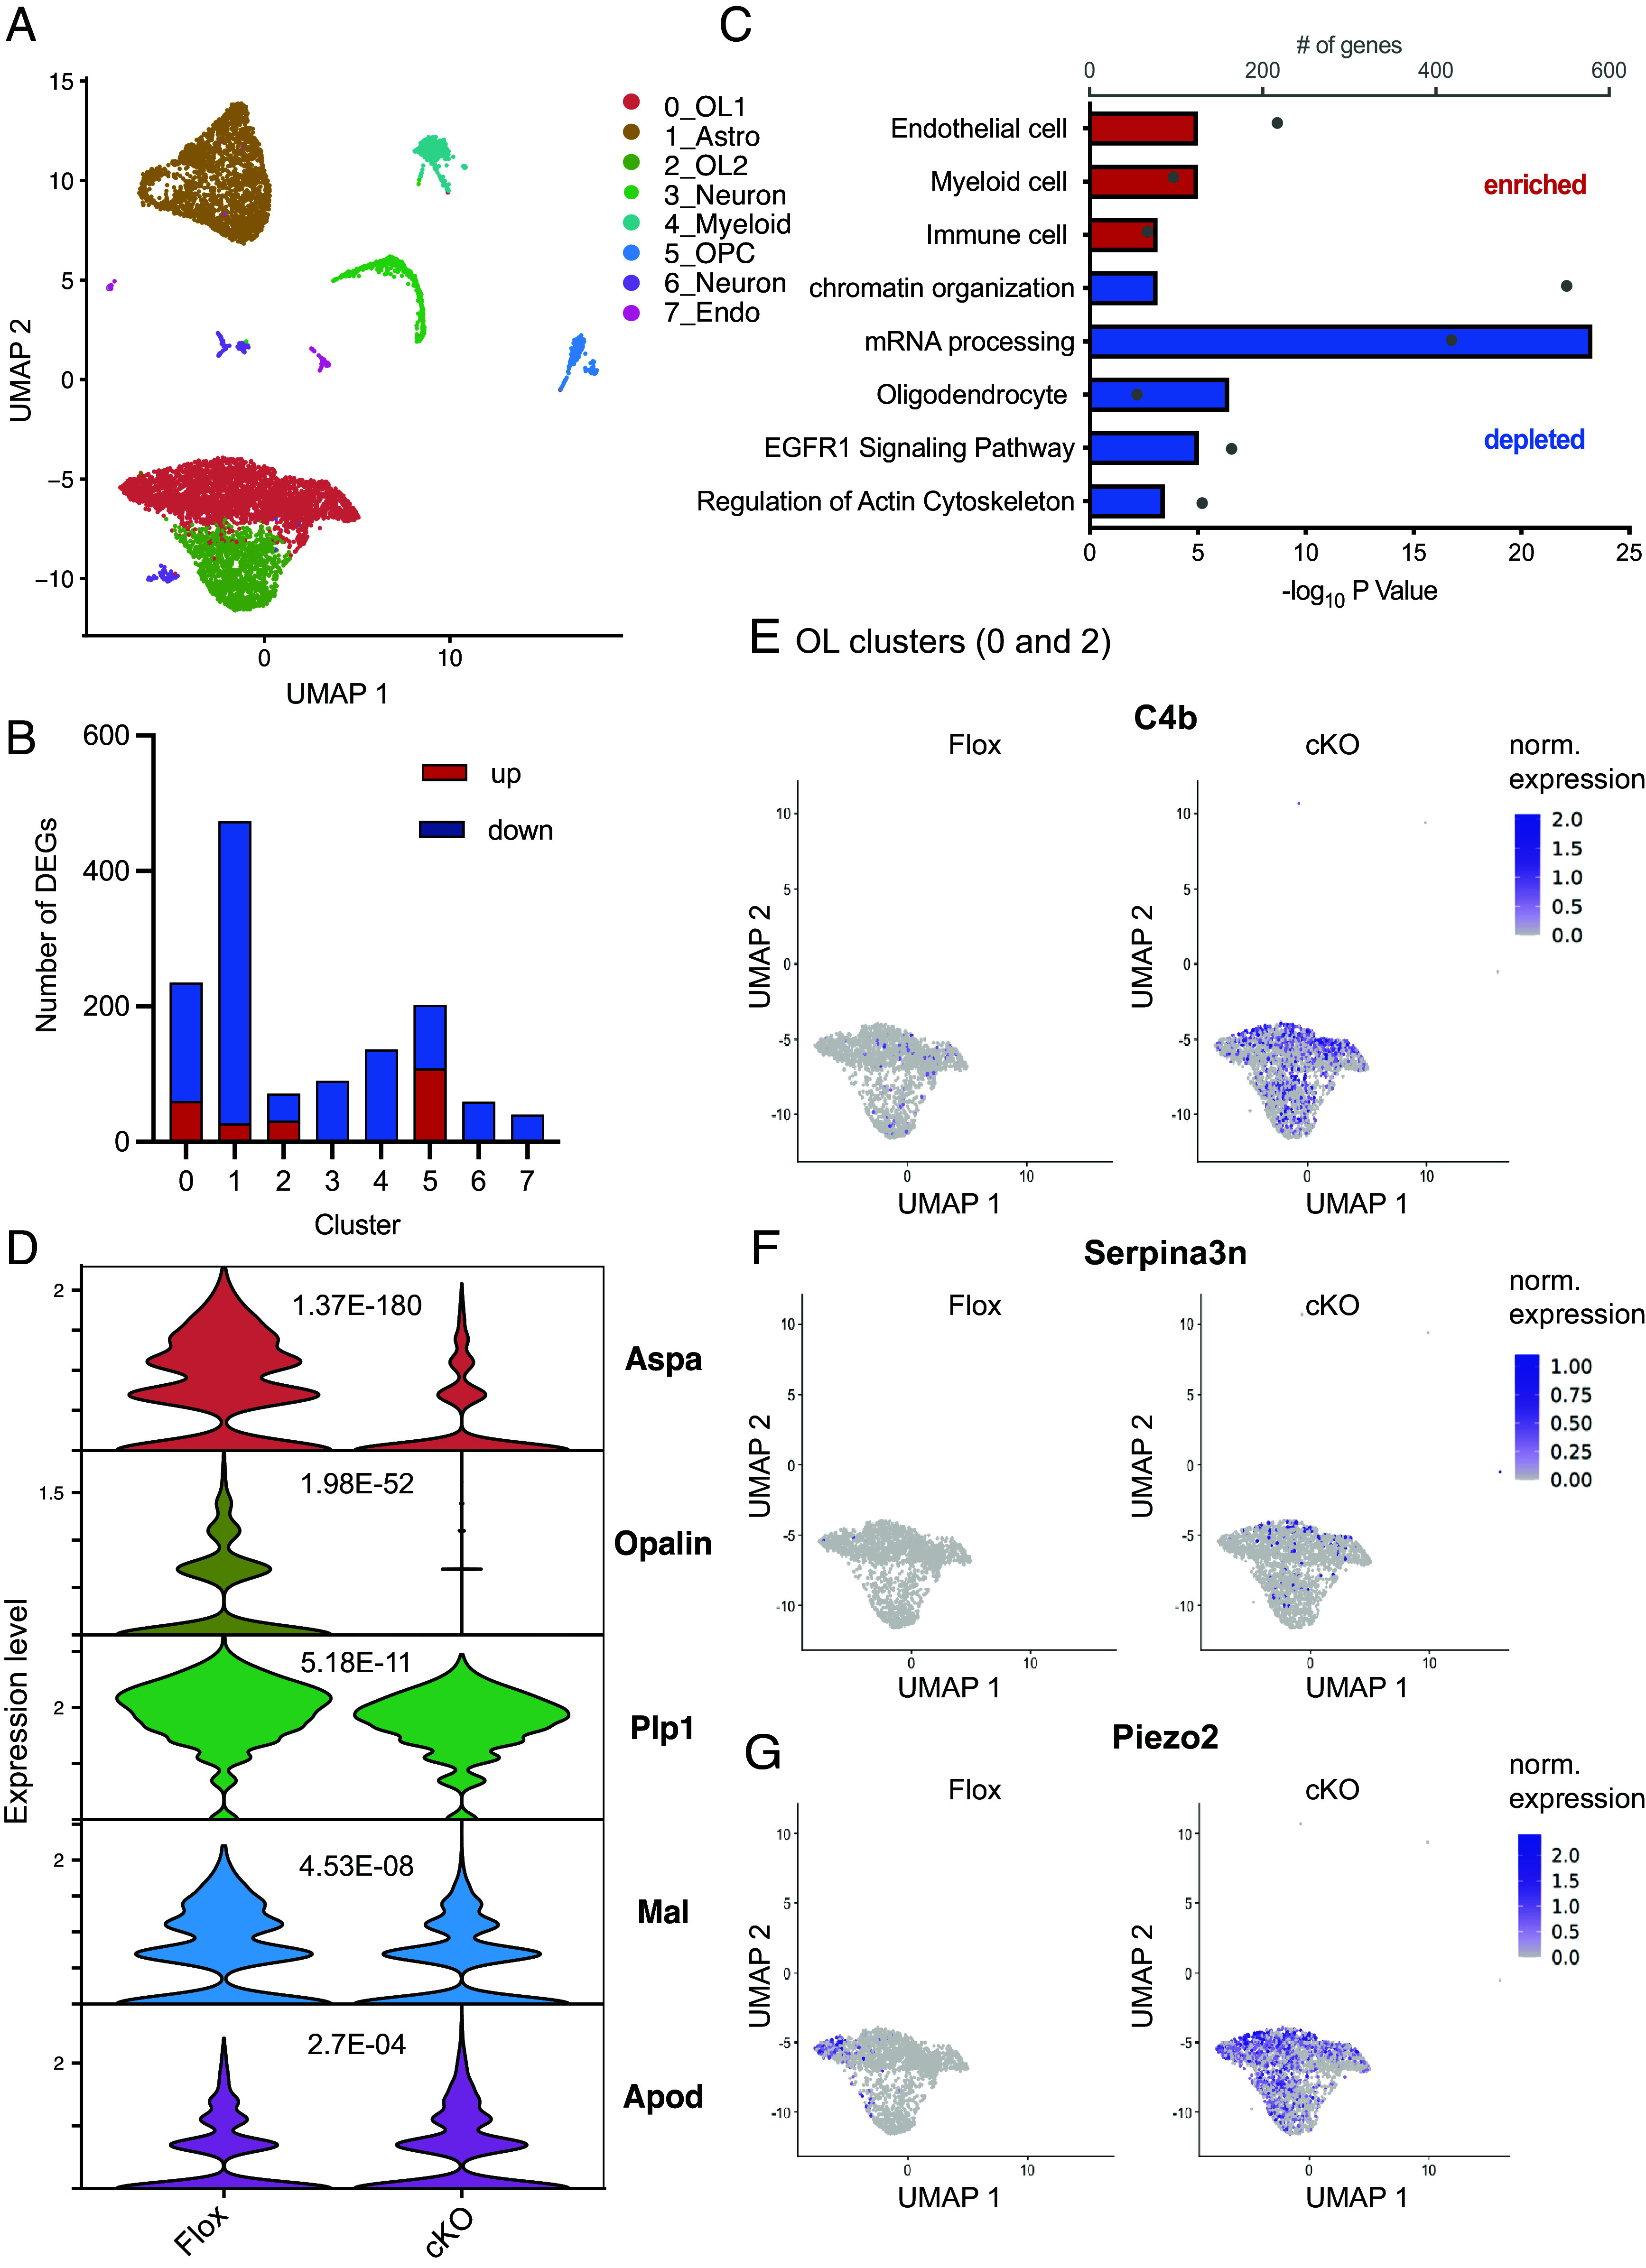
Fig. 6.

Loss of SRF induces oligodendrocyte disease–associated genes. (A) UMAP plot showing Seurat clusters and their annotation of 10-mo-old SRF-Flox and SRF-cKO NeuN− nuclei sequenced by 10× snRNA-seq. (B) Bar graph showing the number of DEGs significantly (P.adj < 0.05) up- (red) or down-regulated (blue) in each Seurat cluster. (C) Pathways enriched or depleted in SRF-cKO oligodendrocytes (clusters 0 and 2 combined) detected by Gene Set Enrichment Analysis (GSEA) of descending Log 2FC. (D) Violin plots of expression levels and P-adj. values of top differentiated mature oligodendrocyte marker genes. (E) Scatter plot showing the normalized expression of C4b overlayed over the oligodendrocyte clusters (0 and 2) split by SRF-Floxed and SRF-cKO groups. (F) Scatter plot showing the normalized expression of Serpina3n overlayed over the oligodendrocyte clusters (0 and 2) split by SRF-Floxed and SRF-cKO groups. (G) Scatter plot showing the normalized expression of Piezo2 overlayed over the oligodendrocyte clusters (0 and 2) split by SRF-Floxed and SRF-cKO groups.
