Fig. 1.
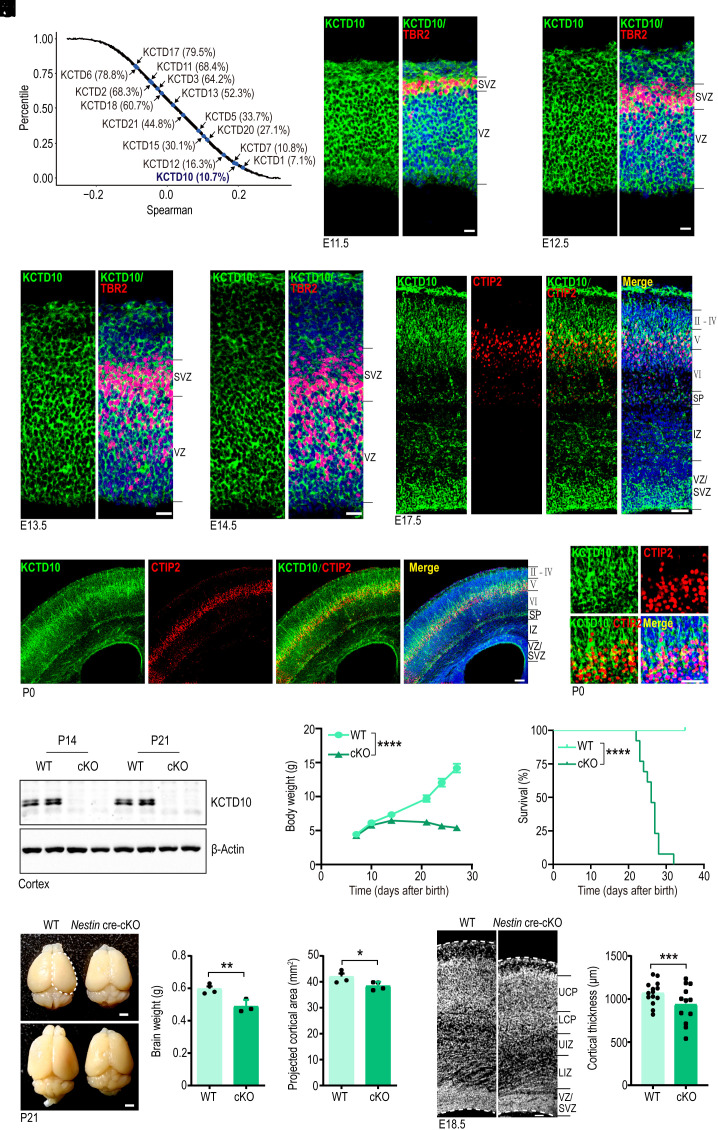
Kctd10 cKO in the brain leads to severe developmental defects. (A) Co-expression analyses of KCTD family genes with NDD genes. The percentile of the average correlation coefficient for all developing cortex-expressed genes with NDD genes. The average percentile of KCTD family genes was marked. (B–E) Representative images of E11.5 (B), E12.5 (C), E13.5 (D), and E14.5 (E) cortices co-stained for KCTD10 (green), TBR2 (red), and DAPI (blue). (F) Representative images of E17.5 cortices stained for KCTD10 (green), CTIP2 (red), and DAPI (blue). (G) Representative images of P0 cortices stained for KCTD10 (green), CTIP2 (red), and DAPI (blue). (H) Magnifying images of P0 cortices stained for KCTD10 (green), CTIP2 (gray), and DAPI (blue). (I) Western blot confirms KCTD10 loss in the cortex of Nestin-cKO mice at P14 and P21. (J) Body weight of WT and cKO mice from P7 to P28. WT and cKO: n = 10. (K) Survival curve of WT and Kctd10 cKO mice. WT and cKO: n = 13. (L) WT and cKO brains at P21 (Left). Brain weight (Middle) and projected cortical area (Right) of WT and cKO mice. WT and cKO: n = 5. (M) Representative images of WT and cKO cortex stained with DAPI at E18.5 (Left). Quantification of cortical thickness (Right). WT and cKO: n = 9/3 (n, slice numbers/brain numbers). All data are means ± SEM (error bars). Student’s t test. *P < 0.05; **P < 0.01; ***P < 0.001; ****P < 0.0001. [Scale bars: 20 μm (B–E), 50 μm (F, H, and M), 100 μm (G) and 2 mm (L).]

