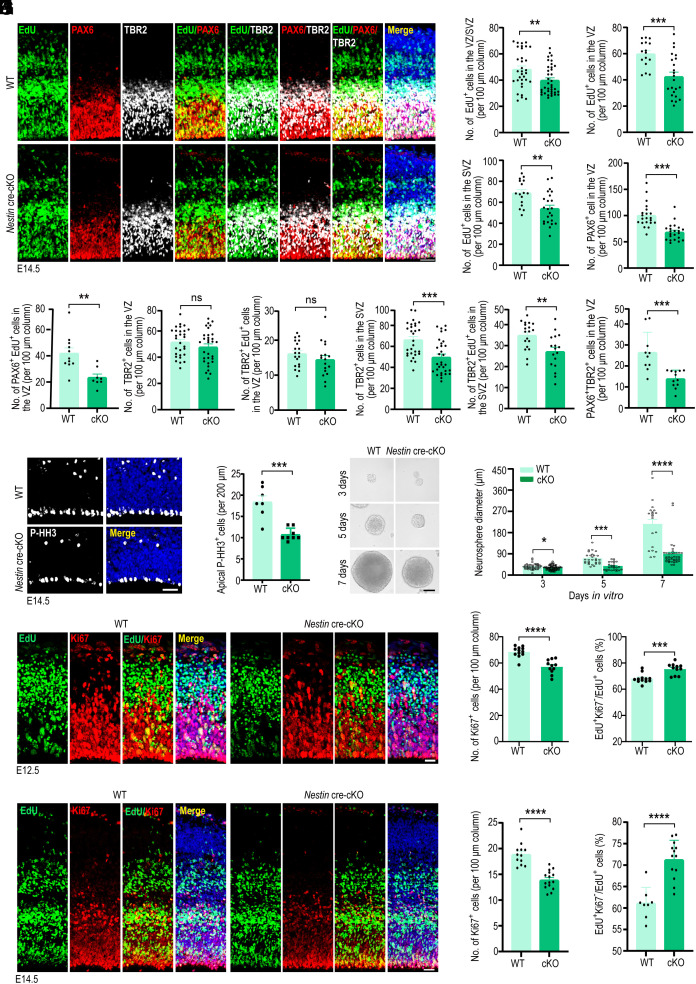
Fig. 2.
KCTD10 regulates NPC development in the cortex. (A) Representative images of E14.5 WT and Kctd10 cKO mouse cortices stained for EdU (green), PAX6 (red), TBR2 (white), and DAPI (blue). EdU was injected at E13.5. (B) Quantification of the total number of EdU+ cells in the VZ and SVZ, and PAX6+ cells in the VZ per 100 µm column in A. WT: n = 33/8, cKO: n = 37/10. (C) Quantification of EdU+; PAX6+ in the VZ (WT: n = 11/3, cKO: n = 8/3), TBR2+ cells in the VZ and SVZ (WT: n = 19/3, cKO: n = 17/5), EdU+;TBR2+ in the VZ and SVZ (WT: n = 29/4, cKO: n = 31/5) and PAX6+;TBR2+ cells (WT: n = 11/3, cKO: n = 9/3) per 100 μm column. (D) Representative images of E14.5 WT and cKO cortices stained for P-HH3 (gray). (E) Quantification of apical P-HH3+ cells per 200 µm, WT: n = 15/3, cKO: n = 15/3. (F) Representative images of second-generation neurospheres derived from WT and cKO cortices. (G) Quantification of the diameters of neurospheres in F. Day 3 (WT: n = 46/3, cKO: n = 72/3), Day 5 (WT: n = 29/3, cKO: n = 26/3), Day 7 (WT: n = 20/3, cKO: n = 38/3), (n, neurosphere numbers/brain numbers). (H) Representative images of WT and cKO cortices stained for EdU (green), Ki67 (red), and with DAPI (blue). (I) Quantification of the number of Ki67+ cells per 100 μm column, and the percentage of EdU+; Ki67−/EdU+ cells represented exiting the cell cycle. WT: n = 12/3, cKO: n = 11/3. (J) Representative fluorescent images of E14.5 WT and cKO cortices stained for EdU (green), Ki67 (red), and with DAPI (blue). (K) Determination of the number of Ki67+ cells per 100 μm column (WT: n = 12/3, cKO: n = 15/4), and the percentage of EdU+; Ki67−/EdU+ cells (WT: n = 8/3, cKO: n = 13/4). All data are means ± SEM. Student’s t test. *P < 0.05, **P < 0.01, ***P < 0.001, ****P < 0.0001. n in B, C, E, I, and K = slice/brain numbers. [Scale bars: 50 μm (A, D, and F), 20 μm (H), 25 μm (J).]

