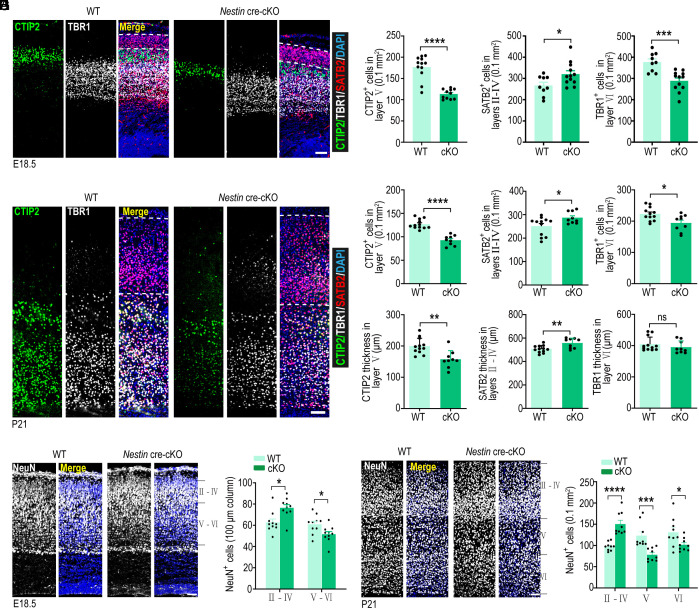
Fig. 3.
Kctd10 deficiency leads to abnormal neuron production. (A) Representative images of E18.5 WT and cKO cortical sections stained with SATB2 (red), CTIP2 (green), TBR1 (gray), and DAPI (blue). (B) Quantification of the number of SATB2+, CTIP2+, and TBR1+ neurons per 0.1 mm2 in A. CTIP2 (WT: n = 12/4, cKO: n = 9/3), TBR1, and SATB2 (WT: n = 9/3, cKO: n = 12/4). (C) Representative images of P21 WT and cKO cortical sections stained for SATB2 (red), CTIP2 (green), TBR1 (gray), and DAPI (blue). (D) Quantification of the number of CTIP2+, SATB2+, and TBR1+ neurons and their thickness in C. CTIP2, SATB2, and TBR1 (WT: n = 12/4, cKO: n = 9/3). (E) Representative coronal sections of E18.5 WT and cKO brains stained for NeuN (gray). (F) Quantification of NeuN+ cells per 100 μm column in E. WT: n = 12/4, cKO: n = 9/3. (G) Representative coronal sections of P21 WT and cKO brains stained for NeuN (gray). (H) Quantification of NeuN+ cells per 0.1 mm2 in G. WT and cKO: n = 9/3. All data are presented as means ± SEM. *P < 0.05, **P < 0.01, ns: no significance. Student’s t test. Slice thickness: 20 μm (A, C, and G), 30 μm (E). n in B, D, F, and H = slice/brain numbers. [Scale bars: 50 μm (A and E), 100 μm (C and G).]

