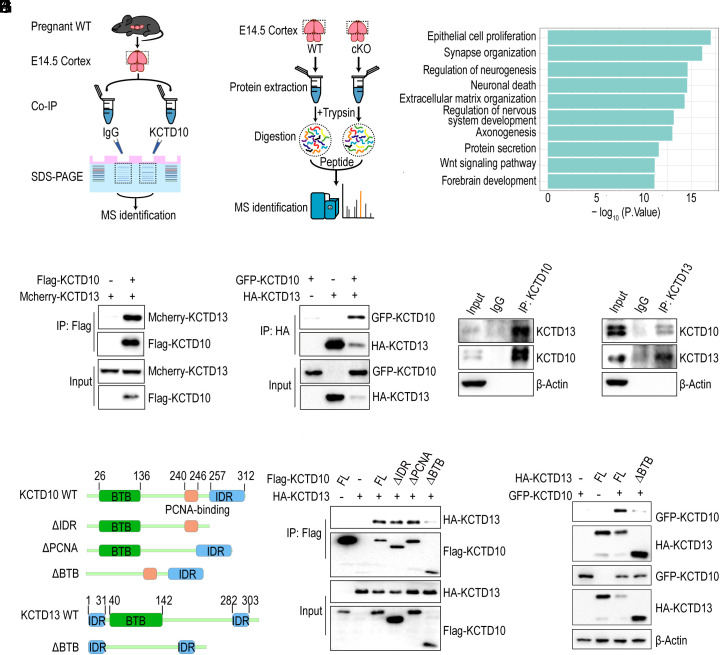
Fig. 4.
KCTD10 interacts with KCTD13. (A) Schematic diagram illustrating the procedure of IP-MS assay. IP: immunoprecipitation, MS: mass spectrum. (B) Schematic plot illustrating the procedure of quantitative MS assay of E14.5 WT and cKO cortex. (C) GO enrichment analysis of DEPs identified in cKO cortices. (D) KCTD10 interacts with KCTD13. Co-IP with anti-Flag beads was performed with cell lysates from HEK293 cells transfected with Mcherry-KCTD13 alone or together with Flag-KCTD10, and probed with Flag and RFP antibodies. (E) The interaction of KCTD13 with KCTD10. Co-IP with an anti-HA antibody was performed with cell lysates from HEK293 cells transfected constructs as indicated and analyzed with HA and GFP antibodies. (F and G) Interaction between endogenous KCTD10 and KCTD13 in the cortex was confirmed by co-IP with KCTD10 (F) and KCTD13 (G) antibodies. (H) Schematic representation of KCTD10 and KCTD13 as well as their truncations. (I and J) The BTB domains of KCTD10 and KCTD13 are essential for their interaction. Co-IP was performed with HEK293 cells transfected with the indicated constructs using anti-Flag or HA antibodies and probed with Flag, HA, or GFP antibodies.

