Fig. 5.
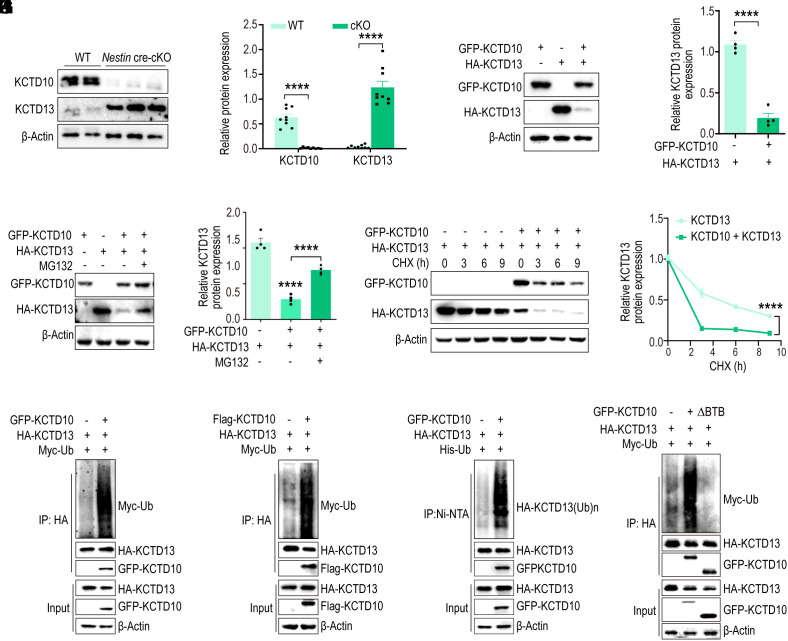
KCTD10 regulates the stability of KCTD13 through the proteasomal pathway. (A) P14 cortices from cKO and WT littermates were analyzed by immunoblotting for the expression of KCTD13 and KCTD10, with β-Actin as a loading control. (B) Quantification of relative levels normalized with β-Actin. N = 9 from > 3 independent experiments. (C) Overexpression of KCTD10 in HEK293 cells results in decreased KCTD13 levels. Cell lysates were analyzed by immunoblotting with GFP, HA, and β-Actin antibodies. (D) Quantification of relative levels of KCTD13 normalized with β-Actin. n = 4 from 4 independent experiments. (E) HEK293 cells were transfected with constructs as indicated and treated with MG132 for 4 h prior to analyzing with GFP and HA antibodies. (F) Quantification of relative levels of KCTD13 normalized with β-Actin. n = 4 from 4 independent experiments. (G) KCTD13 was transfected alone or together with KCTD10 and the half-life of KCTD13 was inspected by CHX chase assay by western blot analysis. (H) The relative level of KCTD13 was quantified and normalized against β-Actin. n = 3 independent experiments. (I–K) KCTD13 ubiquitination levels in HEK293 cells co-transfected with indicated constructs, together with or without GFP-KCTD10, and treated with MG132 for 4 h. KCTD13 was immunoprecipitated from cell lysates with HA antibody (I and J), and ubiquitinated proteins were pulled down by Ni-NTA beads from cell lysates under denaturing conditions (K) and immunoblotted with antibodies as indicated. (L) KCTD10 without the BTB domain cannot induce ubiquitination of KCTD13. HA-KCTD13 and Myc-Ub were co-transfected with KCTD10, immunoprecipitated with HA antibody, and probed with HA, GFP, and Myc antibodies. All data are presented as means ± SEM. ****P < 0.0001. Student’s t test (B and D), One-way ANOVA (F), Two-way ANOVA (H).

