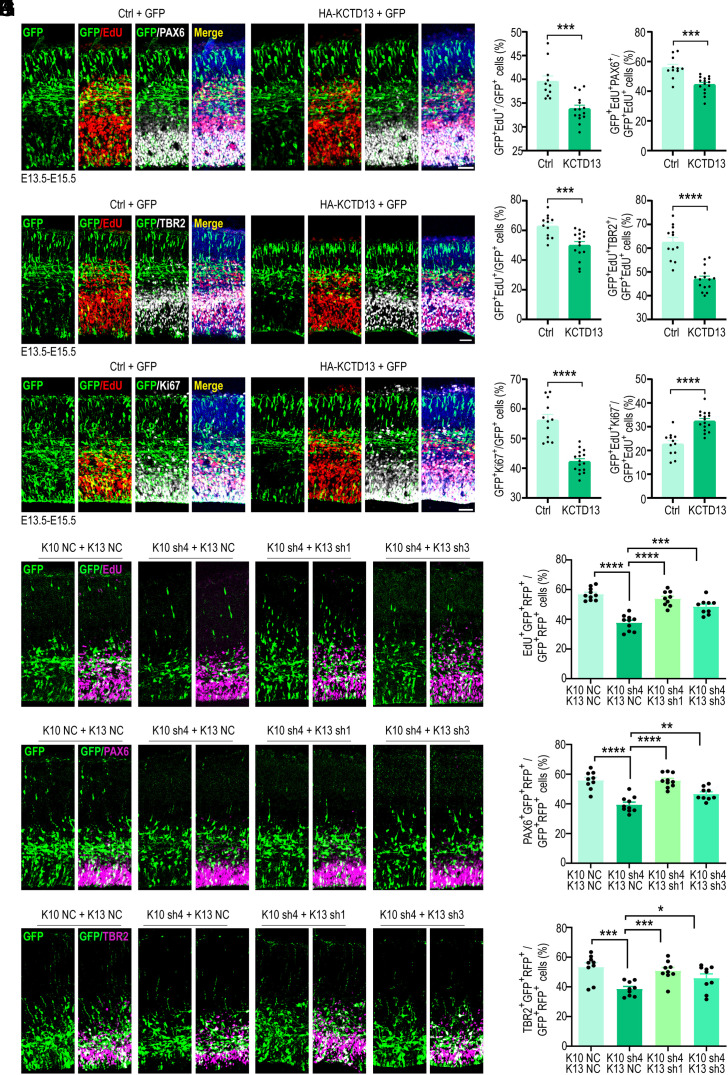
Fig. 6.
Overexpression of KCTD13 inhibits NPC proliferation and promotes NPC differentiation. (A–F) All images are from E15.5 cortices electroporated at E13.5 with empty vector (Ctrl) or HA-KCTD13 together with a GFP-expressing construct and stained with indicated antibodies 24 h after EdU labeling at E14.5. (A) Representative images stained for GFP (green), EdU (red), PAX6 (gray), and DAPI (blue). (B) Quantification of transfected cells positive for EdU or PAX6. Ctrl: n = 11/3, HA-KCTD13: n = 15/4. (C) Representative images stained for GFP (green), EdU (red), TBR2 (gray), and DAPI (blue). (D) Quantification of transfected cells positive for EdU or TBR2. Ctrl: n = 12/3, HA-KCTD13: n = 15/4. (E) Representative images stained for GFP (green), EdU (red), Ki67 (gray), and DAPI (blue). (F) Quantification of transfected cells positive for EdU or Ki67. Ctrl: n = 12/3, HA-KCTD13: n = 16/4. (G–L) All images depict E15.5 cortices electroporated at E13.5 with the following constructs: empty vector (K10 NC+K13 NC), K10 sh4 + K13 NC, K10 sh4 + K13 sh1, or K10 sh4 + K13 sh3. The brain sections were stained with the indicated antibodies 24 h after EdU labeling at E14.5. (G) Representative images depicting GFP (green) and EdU (magenta) staining. (H) Quantification of transfected cells positive for EdU. K10 NC + K13 NC and K10 sh4 + K13 NC: n = 10/3, K10 sh4 + K13 sh1 and K10 sh4 + K13 sh3: n = 9/3. (I) Representative images depicting GFP (green) and PAX6 (magenta) staining. (J) Quantification of transfected cells expressing PAX6. K10 NC + K13 NC: n = 9/3, K10 sh4 + K13 NC and K10 sh4 + K13 sh1: n = 10/3, K10 sh4 + K13 sh3: n = 9/3. (K) Representative images stained for GFP (green) and TBR2 (magenta). (L) Quantification of transfected cells expressing TBR2. K10 NC + K13 NC, K10 sh4 + K13 NC, K10 sh4 + K13 sh1, K10 sh4 + K13 sh3: n = 9/3. All data are presented as means ± SEM. *P < 0.05, **P < 0.01, ***P < 0.001, ****P < 0.0001, Student’s t test. n = slice/brain numbers. [Scale bars: 50 μm (A, C, E, G, I, and K).]

