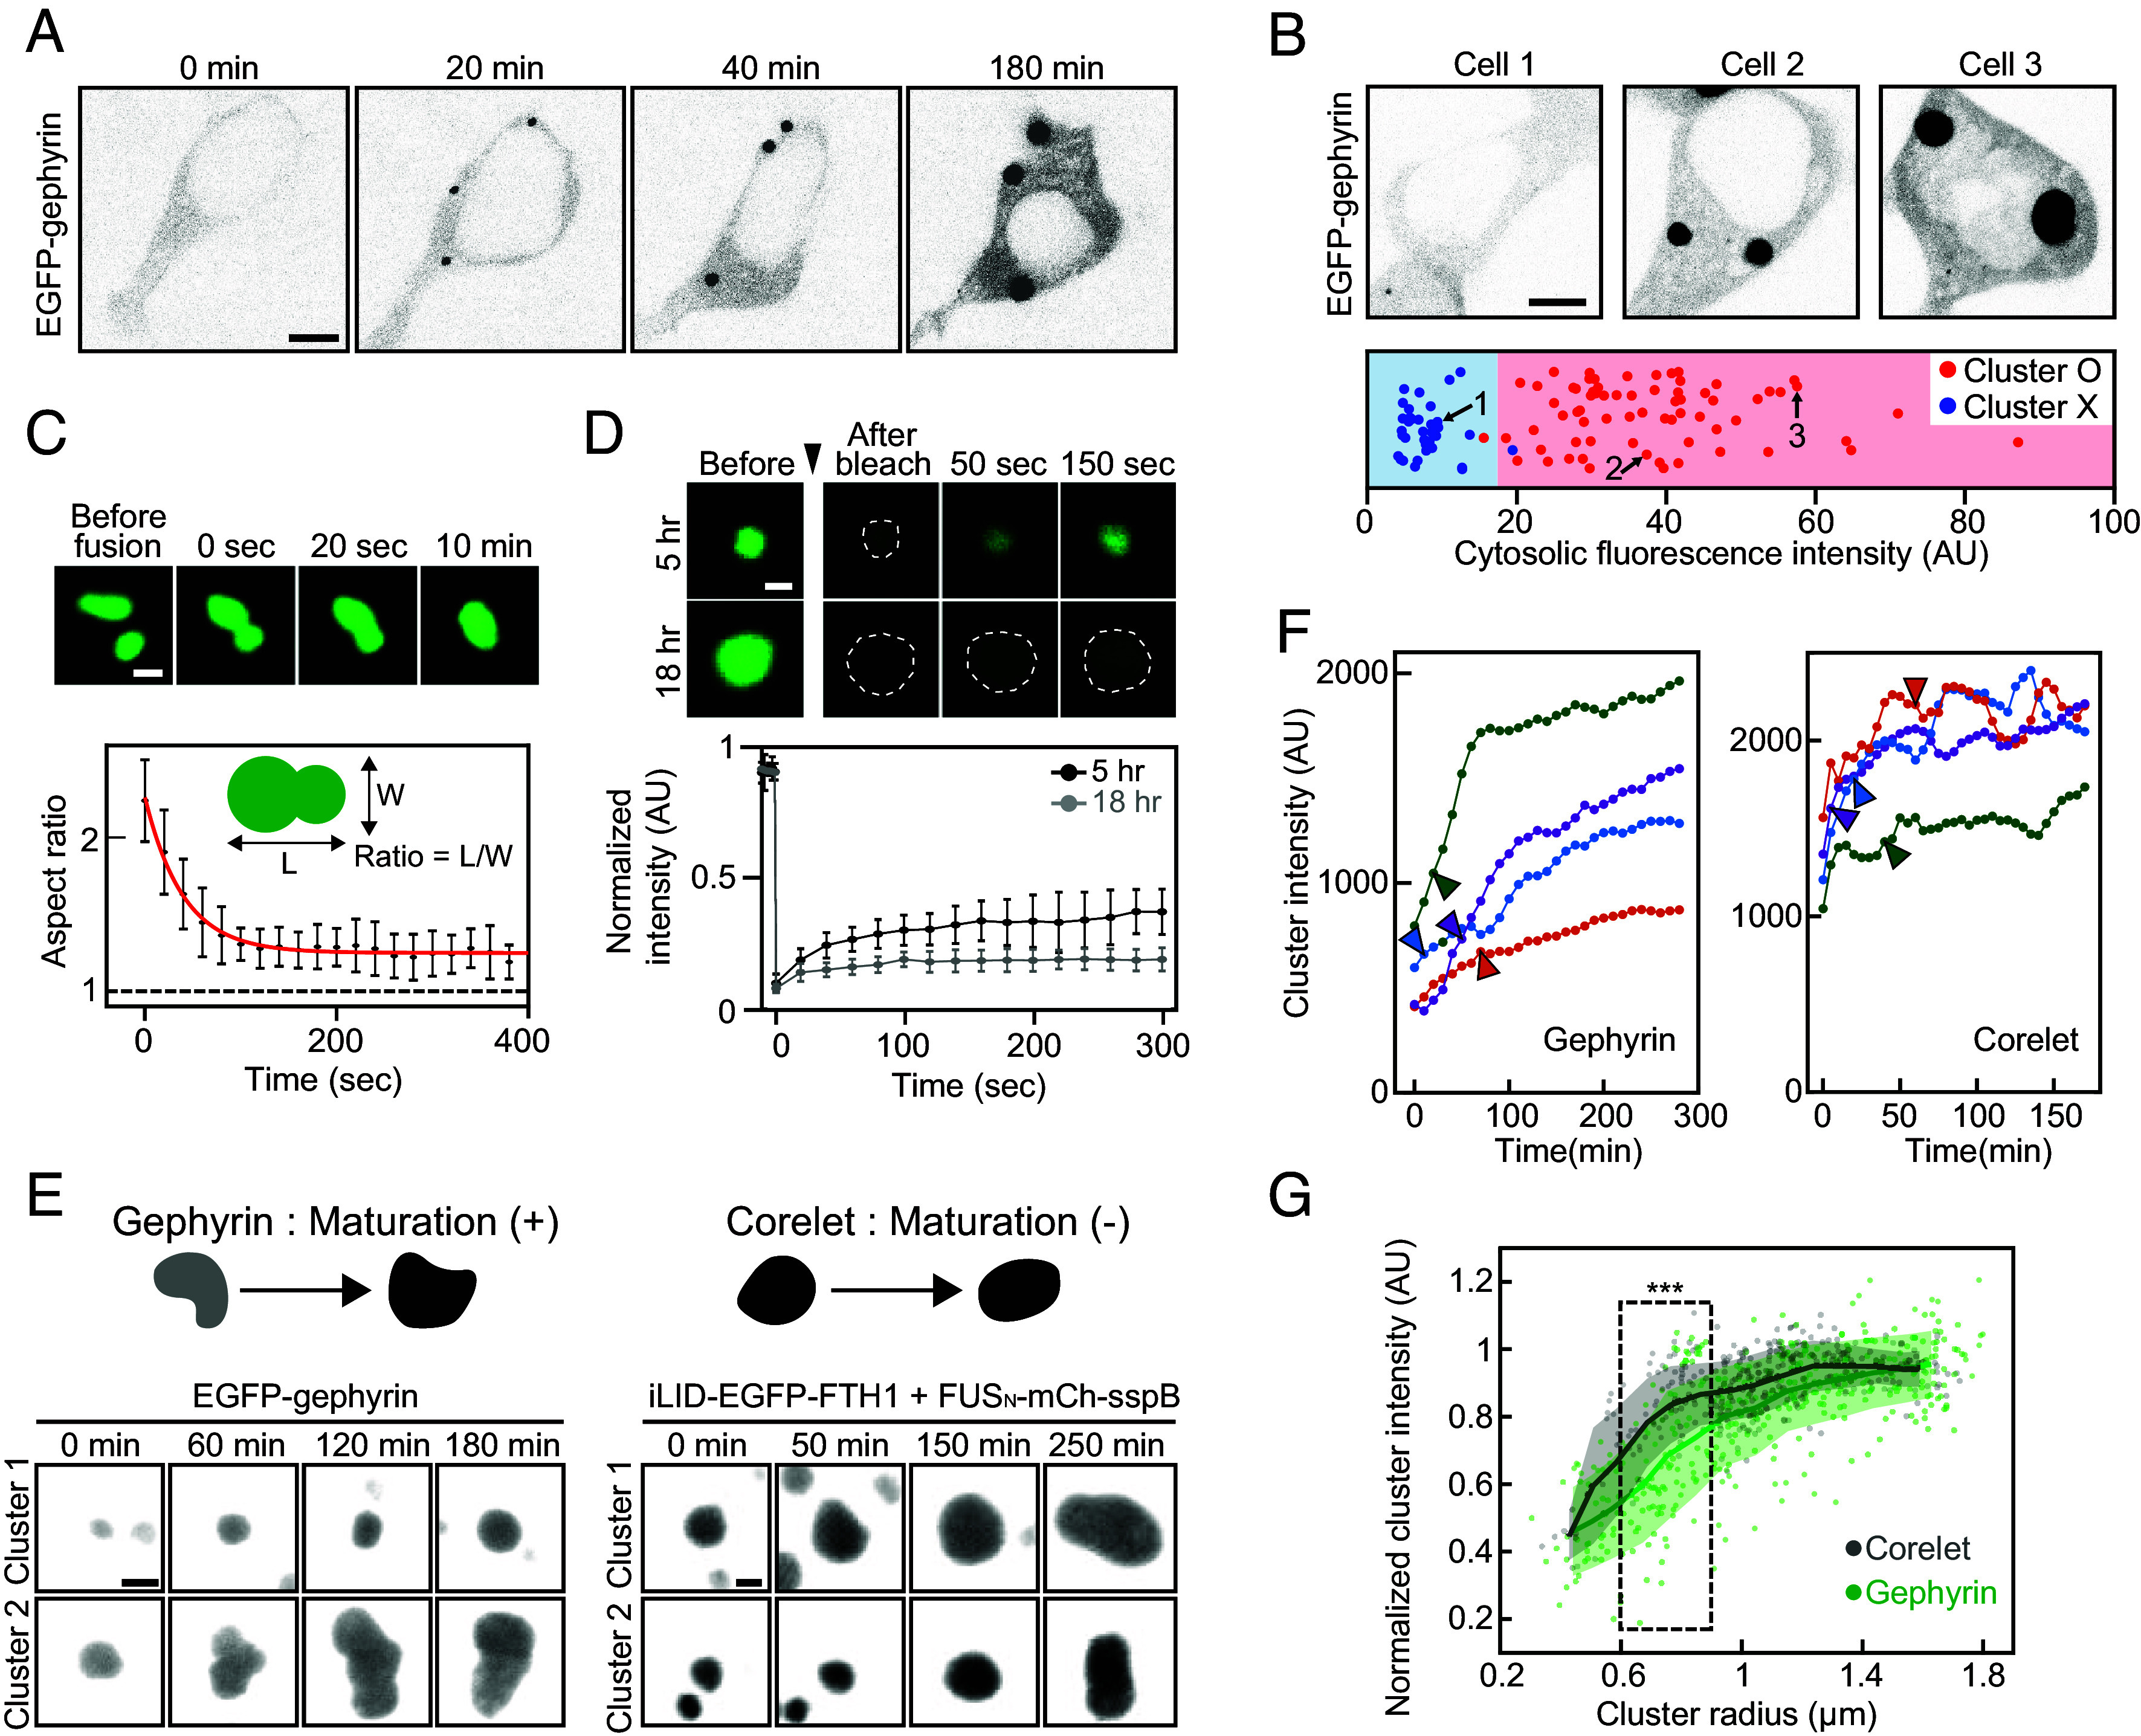
Fig. 1.

The concentration-dependent phase separation of gephyrin. (A) Inverted black and white time-lapse images of EGFP-tagged gephyrin in the HEK293T cell. The cell was transfected with EGFP-gephyrin around 5 h prior to imaging. (Scale bar, 6 μm.) (B) (Top) Fluorescence images of EGFP-tagged gephyrin in HEK293T cells. (Scale bar, 6 μm.) (Bottom) Cytosolic fluorescence intensity of individual EGFP-gephyrin expressing cells. Data points are color-coded for the presence of condensates. n = 3 experiments (total 105 cells). Data points are randomly scattered along the vertical axis for better readability. (C) (Top) Fluorescence time-lapse images of two gephyrin clusters undergoing fusion. (Scale bar, 2 μm.) (Bottom) Mean aspect ratios of the fused clusters as a function of time. A red curve denotes an exponential fit to data. Error bars ± SD; n = 8 (from five cells). (D) (Top) FRAP images of gephyrin clusters at the indicated time points after transfection. Cluster boundaries are indicated with dashed lines. (Scale bar, 1 μm.) (Bottom) FRAP recovery curves of gephyrin clusters at the indicated time points after transfection. Error bars ± SD; n = 5 (from five cells) for each condition. (E) Fluorescence images of gephyrin and FUS Corelet clusters over time. Schematic for the maturation of condensates that accompanies an increase in component concentration is shown. Scale bar, 2 μm (gephyrin); 1 μm (Corelet). (F) Examples of fluorescence intensity changes within gephyrin (Left) and Corelet (Right) cluster over time. Data points are moving-averaged over every three values. Time points at which condensate radius first exceeds 0.75 μm are indicated as arrowheads. (G) Fluorescence intensities of individual gephyrin and Corelet clusters, normalized based on maximum values within individual cells, are plotted against cluster radius. Clusters at several time points were measured from multiple cells for each sample type. Solid lines and shaded areas indicate the average and SD of data points located within a 0.3-μm window. Data points located within 0.6 to 0.9 μm interval are compared using Welch’s t test, ***P < 0.0001. Corelet, n = 325 (12 cells); gephyrin, n = 410 (16 cells).
