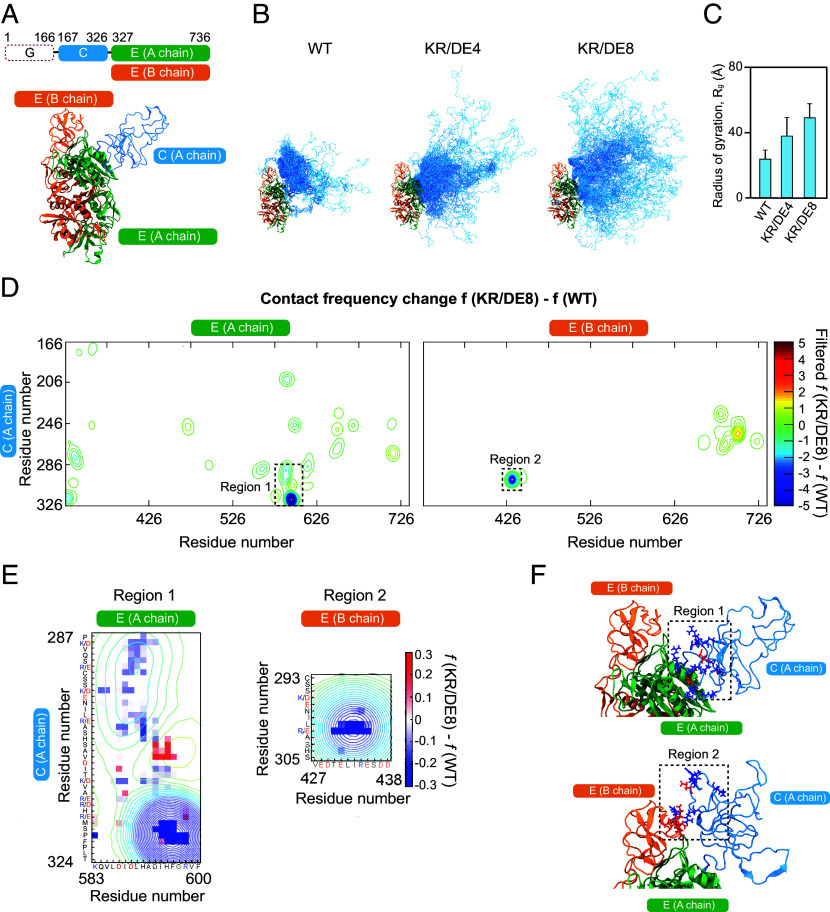
Fig. 4.
Atomistic simulations reveal the details of intra- and interdomain interactions of gephyrin. (A) Domain architecture and 3D structure of the model system used in simulations. Different colors indicate different domains, as noted in the domain architecture. (B) Structural ensembles of gephyrin WT and different variants. Domains are color-coded same as panel (A). (C) Radii of gyration for the C domain. Error bars ± SD; WT, 23.6 ± 5.5 Å; KR/DE4, 37.9 ± 11.5 Å; KR/DE8, 49.1 ± 8.7 Å. (D) Contact frequency difference between gephyrin WT and KR/DE8. For each construct, residue-by-residue pairwise contact frequency maps were first generated (SI Appendix, Fig. S5 E and F), and then, the frequency differences (SI Appendix, Fig. S5G) were filtered with Gaussian function for readability (Materials and Methods). Two regions that show significant reduction in contact frequency are highlighted by dashed boxes. (E) Enlarged map of regions 1 and 2 in (D). Pixelated images of raw contact frequency difference are overlaid on the contours of filtered data in (D). (F) Simulation snapshots showing detailed interactions corresponding to regions 1 and 2. Negatively and positively charged residues in the indicated regions are colored in red and blue, respectively.

