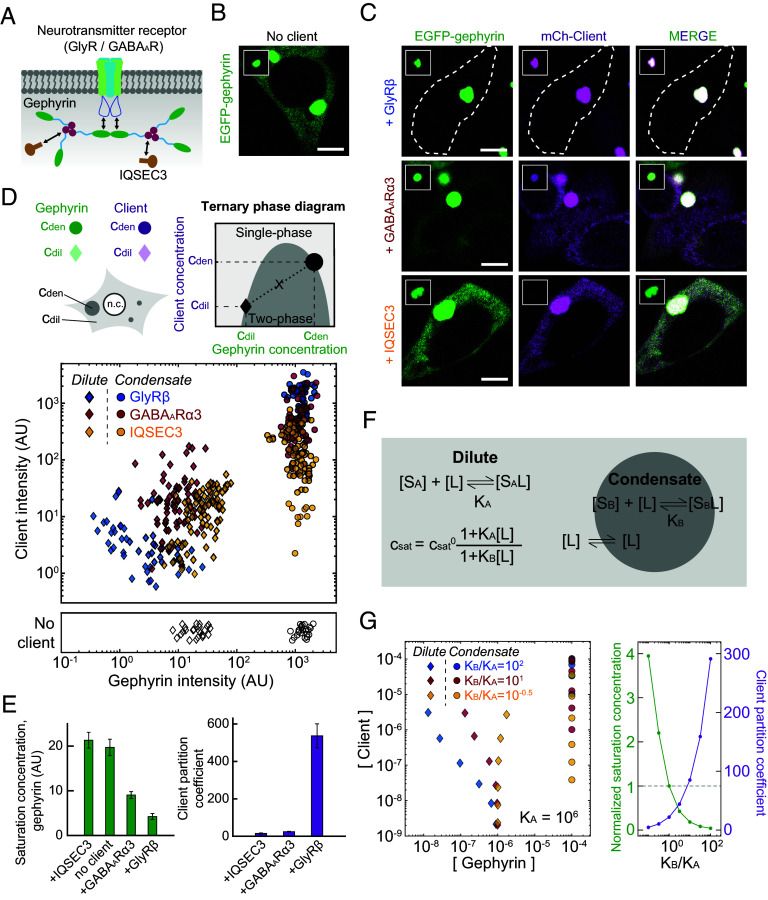
Fig. 6.
iPSD components thermodynamically modulate gephyrin phase separation. (A) Schematic diagram of iPSD components used in this study and intermolecular interactions between them. (B and C) Fluorescence images of HEK293T cells expressing EGFP-tagged gephyrin WT alone (B) or coexpressing EGFP-tagged gephyrin and mCh-tagged iPSD components (C). Gephyrin and iPSD component expression levels are similar across these cells. For comparison, images are shown at the same brightness level. White dotted lines indicate cell boundary. Insets display gephyrin condensates in individual cells. Note that different brightness levels are used between the whole-cell images and insets. (Scale bars, 6 μm.) (D) (Top) Schematic diagram of the ternary phase diagram for gephyrin and iPSD components. Fluorescence intensities of molecules inside and outside of condensates constitute right- and left-hand boundaries of the two-phase region, respectively. (Bottom) Experimentally measured ternary phase diagram of gephyrin and individual iPSD components. The concentrations of the dilute- and dense phase were measured for cells containing gephyrin condensates. Data acquired with gephyrin alone are shown for comparison. Imaging conditions used in this analysis are different from those in the characterization of saturation concentrations of various gephyrin variants shown in Figs. 1–3. GlyR-β, n = 52; GABAAR-α3, n = 73; IQSEC3, n = 88; no client, n = 25. (E) Saturation concentration of gephyrin in the presence or absence of specific iPSD components (Left). Partition coefficients of iPSD components, defined as a ratio of the concentration inside gephyrin condensates versus the surrounding cytoplasm (Right). Cells with similar expression levels are used in these quantifications. Error bars ± SEM; GlyR-β, n = 37; GABAAR-α3, n = 42; IQSEC3, n = 27; gephyrin alone, n = 17. (F) Schematic diagram of the polyphasic linkage model. Preferential binding of clients to scaffolds in one phase over the other leads to a change in scaffold saturation concentration (SI Appendix). In each phase, clients exhibit equilibrium binding to scaffolds, characterized by an association constant Ki. (G) (Left) Predicted ternary phase diagrams based on the polyphasic linkage model (KA = 106 M−1). To generate the diagrams, six different pairs of total gephyrin/client concentrations are used for each condition (Materials and Methods). All concentrations are in molarity. (Right) Changes of normalized saturation concentration and client partition coefficient by preferential binding effects. Results are obtained from model calculation using the identical total concentrations of scaffolds and clients.

