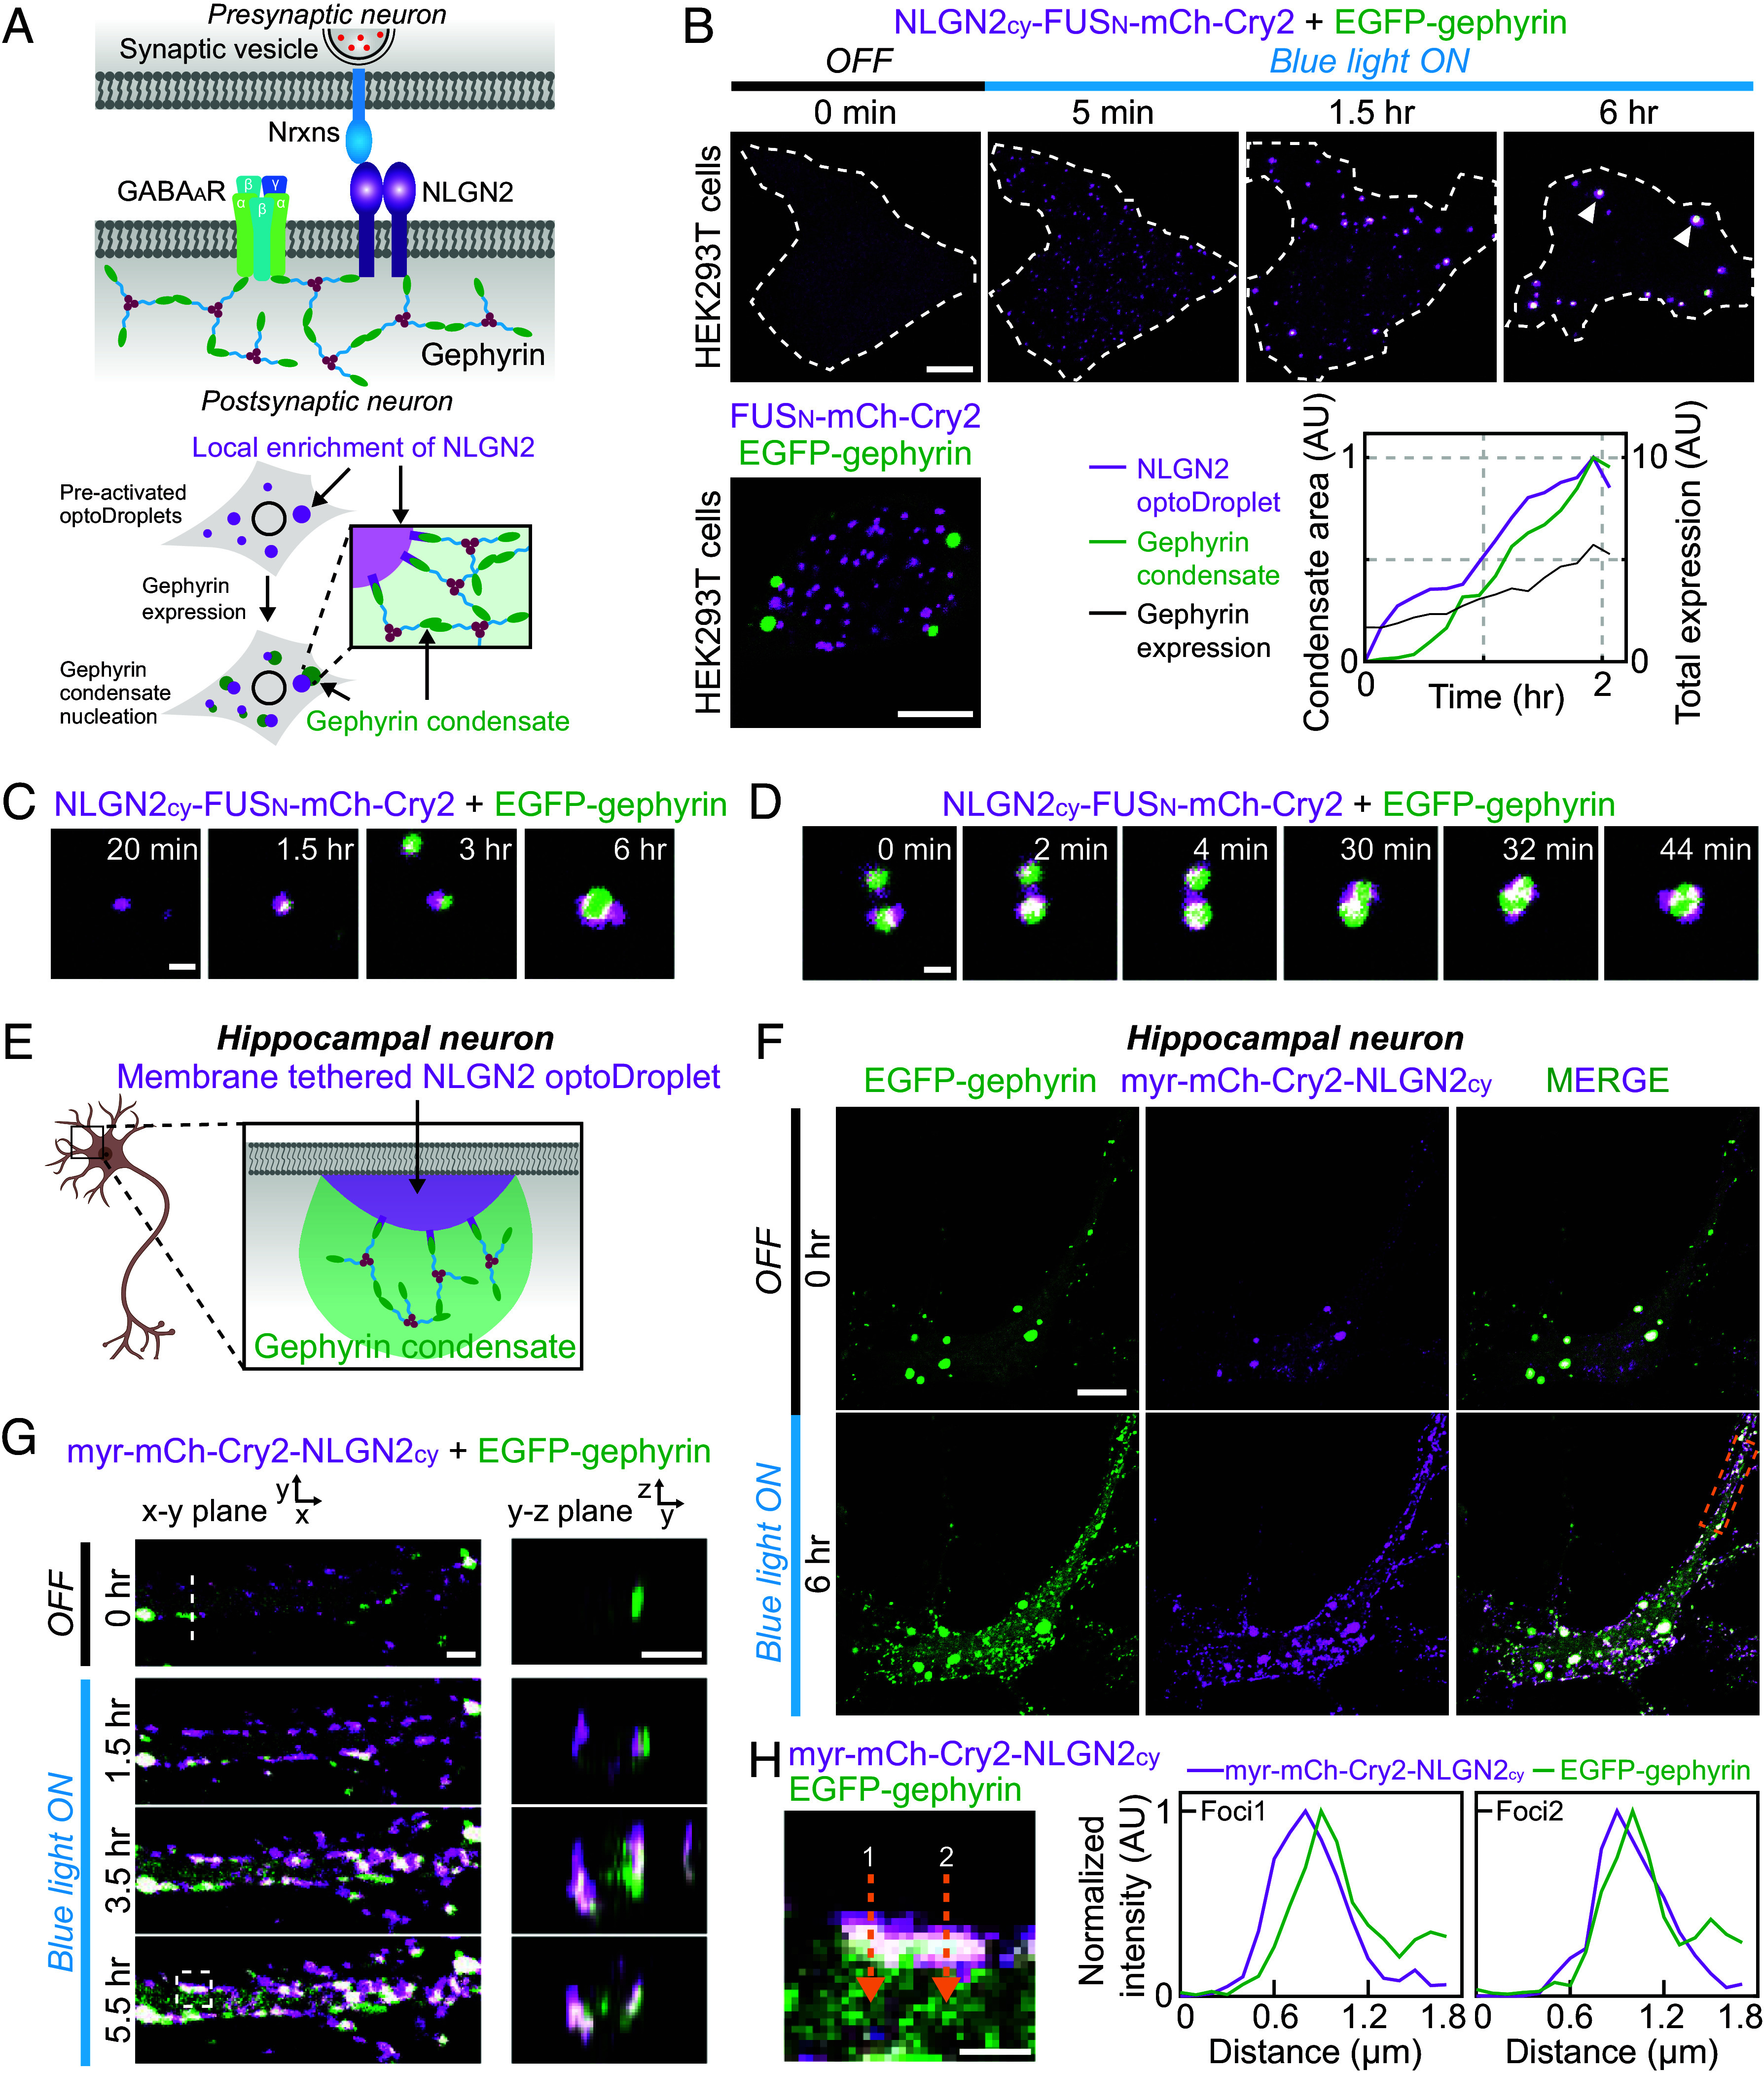
Fig. 7.

Local accumulation of scaffold-binding factors triggers gephyrin condensation. (A) (Top) Schematic diagram of inhibitory synapse components. (Bottom) Schematic diagram of experiments probing the effect of local enrichment of NLGN2 on the nucleation of gephyrin condensates. (B) (Top) Time-lapse fluorescence images of EGFP-tagged gephyrin and NLGN2cy-FUSN-mCh-Cry2 in a HEK293T cell before and after blue-light activation. White dotted lines indicate cell boundary. White arrowheads indicate gephyrin condensates nucleated at NLGN2cy-FUSN-mCh-Cry2 clusters. Images are maximum-projected. The cell is sequentially transfected, first with the optoDroplet construct, followed 24 h after by gephyrin. After blue light–induced clustering of NLGN2cy, an increase in gephyrin expression leads to formation of gephyrin condensates (Bottom Right). (Scale bar, 8 μm.) (Bottom Left) Fluorescence images of EGFP-tagged gephyrin and FUSN-mCh-Cry2 in a HEK293T cell, 30 min after blue-light activation. (Scale bar, 6 μm.) (C and D) Zoomed-in time-lapse images of gephyrin condensation on NLGN2cy optoDroplet clusters (C) and coalescence of condensates (D). (Scale bar, 1 μm.) (E) Schematic diagram of experiments probing the effect of membrane-localized enrichment of NLGN2cy on gephyrin condensation in cultured hippocampal neurons. (F) Fluorescence images of EGFP-tagged gephyrin and myr-mCh-Cry2-NLGN2cy in a cultured mouse hippocampal neuron before and after blue-light activation. (Scale bar, 12 μm.) (G) Zoomed-in time-lapse images of EGFP-tagged gephyrin and myr-mCh-Cry2-NLGN2cy in the white dotted box in (F) before and after blue-light activation. Images of the cross-sections are reconstructed from z-stacks at the white dotted line. (Scale bar, 2 μm.) (H) Zoomed-in image of EGFP-tagged gephyrin and myr-mCh-Cry2-NLGN2cy in the white dashed box of figure (G). (Scale bar, 1 μm.) Fluorescence intensity profiles along yellow dashed arrows are shown on the Right.
