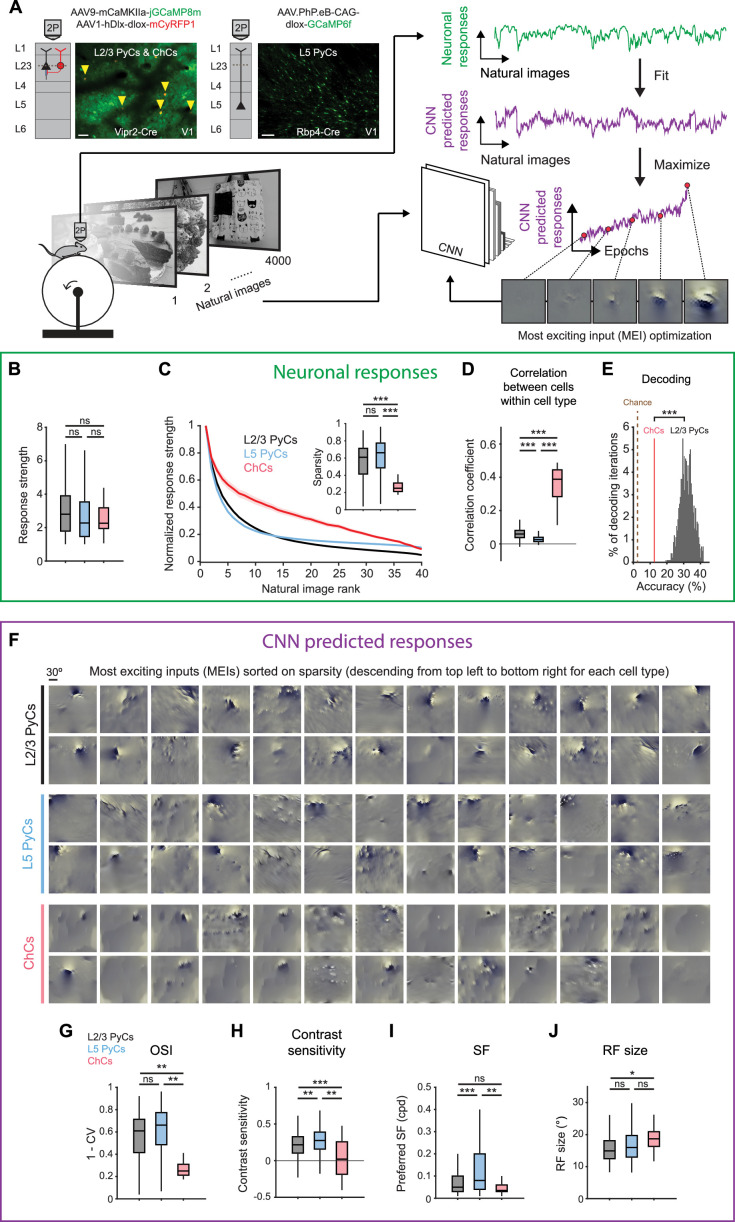
Figure 3. Chandelier cells (ChCs) are weakly selective to visual information.
(A) Schematic of experiment and convolutional neural network (CNN) model fitting. Mice expressing GCaMP8m in L2/3 pyramidal cells (PyCs) and ChCs (Vipr2-Cre mice) or GCaMP6f in L5 PyCs (Rbp4-Cre mice) were shown a set of 4000 images. We trained a CNN to predict single-cell responses to a range of visual stimuli and to derive most exciting inputs (MEIs). Traces (right) represent average responses to natural images (green) and the activity predicted by the CNN (purple) for an example neuron. Scale bars example field of view, 50 µm. (B) Average response strength to natural images for different neuronal cell types. Box plots represent median, quantiles and 95% confidence interval (CI) over neurons. n=1015 L2/3 PyCs, 1601 L5 PyCs and 34 ChCs. LMEM for all comparisons, ***: p<0.001, **: p<0.01, *: p<0.05, ns: not significant. (C) Average normalized response strength for different neuronal cell types on a subset of 40 natural images (compared to baseline, see Materials and methods). Images are ranked on the strength of the response they elicited for each neuron. ChCs curves are flatter than L2/3 PyCs and L5 PyCs, indicating lower stimulus selectivity. Inset: as in B, but for sparsity (a measure for stimulus selectivity). ChCs have lower sparsity than L2/3 PyCs and L5 PyCs. (D) As in B, but for correlation during visual stimulation. ChCs have higher within cell type correlations than L2/3 PyCs and L5 PyCs (21 ± 5.08 ChC pairs per field of view, mean ± SEM). (E) Natural image decoding accuracy for ChCs and L2/3 PyCs. ChC decoding accuracy (red line, 12.55%) was significantly lower than a distribution of decoding accuracies performed using equal numbers of subsampled L2/3 PyCs. Permutation test, ***p<0.001. The brown dotted line indicates theoretical chance level (2.5%). (F) Single-cell MEIs sorted by response sparsity (highest 26 neurons, descending from top left to bottom right). Note the diffuse and unstructured patterns in ChC MEIs. (G) As in B, but for orientation selectivity (OSI). ChCs have lower OSI than L2/3 PyCs and L5 PyCs. (H) As in B, but for contrast sensitivity. ChCs have lower contrast sensitivity than L2/3 PyCs and L5 PyCs. (I) As in B, but for spatial frequency (SF) tuning. ChCs prefer lower SFs than L5 PyCs. (J) As in B, but for receptive field (RF) size. ChCs have bigger RFs than L2/3 PyCs.


