. 2024 Jan 9;12:RP91153. doi: 10.7554/eLife.91153

Figure 4. Locomotion and visuomotor mismatch drive chandelier cell (ChC) activity in a virtual tunnel.

(A) Schematic of approach. Vip2r-Cre mice were head-fixed on a running wheel in a visual virtual tunnel. ChCs were identified using the red fluorophore mRuby2 and neuronal activity of ChCs (yellow arrows) as well as pyramidal cells (PyCs) was tracked using two-photon calcium imaging of GCaMP6f. Scale bar, 50 µm. (B) Virtual tunnel design. Mice ran through a virtual tunnel consisting of a 1-m-long visual section (containing visual stimuli along the walls) immediately followed by a non-visual reward zone in gray screen conditions. In the non-visual section, an auditory cure predicted a water reward 2 s later. After a 6 s timeout the next trial started. (C) Single-cell z-scored average activity of all PyCs (blue/orange) and ChCs (red) during visual, non-visual, and visuomotor mismatch parts of the tunnel (n=1256 PyCs and 38 ChCs, 12 sessions from 6 mice). PyCs were clustered in two populations using hierarchical clustering based on their z-scored activity in the visual section. Cells are sorted on cluster followed by peak activation location. Note the difference in activity between the visual (cluster 1: V-PyCs, blue) and non-visual (cluster 2: NV-PyCs, orange) PyC populations. (D) Average population traces of V-PyCs, NV-PyCs, and ChCs in the visual (left) and non-visual (right) part of the tunnel. Normalized locomotion speed (right y-axis) is depicted in gray. The ChCs follow the activity profile of NV-PyCs. Traces represent mean ± SEM over neurons for ∆F/F and mean ± SEM over sessions for locomotion speed. (E) Average population traces during visuomotor mismatch events. NV-PyCs and ChCs show strong mismatch responses. (F) Average population traces at locomotion onset in the non-visual section of the tunnel. NV-PyCs and ChCs show strong locomotion onset responses. (G) Average activity during visual stimuli (20–80 cm) compared to start of tunnel (0–20 cm). NV-PyCs and ChCs were strongly suppressed by visual stimuli. Box plots represent median, quantiles, and 95% confidence interval (CI) over neurons. LMEM for all comparisons, ***: p<0.001. (H) As in G, but for activity in the entire non-visual part of the tunnel. (I) As in G, but for visuomotor mismatch events. (J) As in G, but for locomotion onset events. (K) Average correlation coefficient of ChCs with PyCs in visual and non-visual section of the tunnel. ChCs are more strongly correlated with NV-PyCs than V-PyCs.

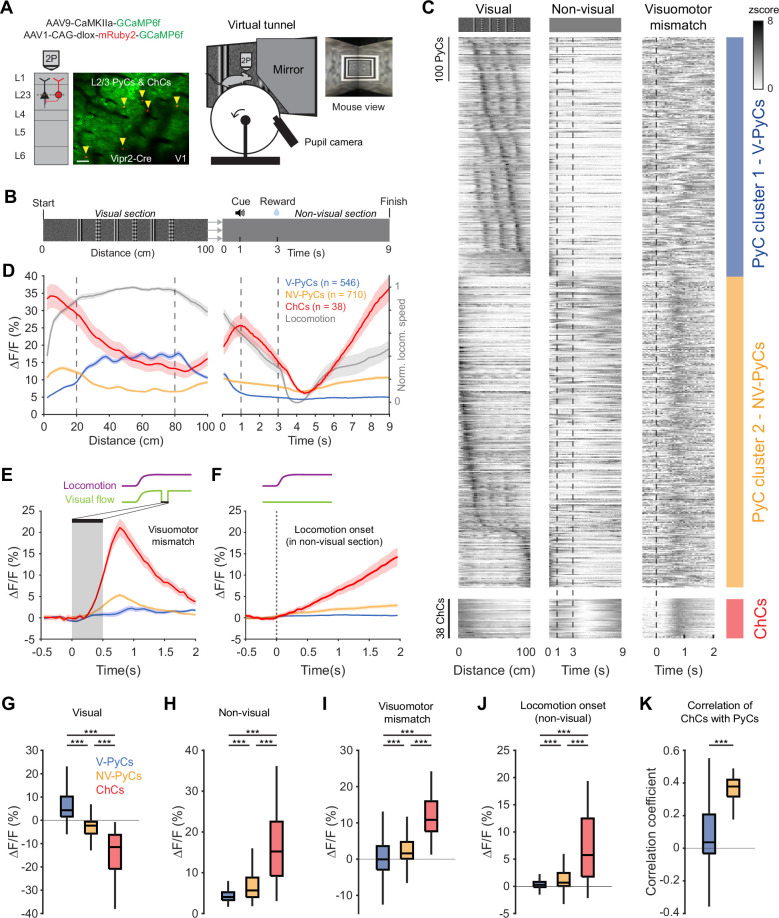
Figure 4.

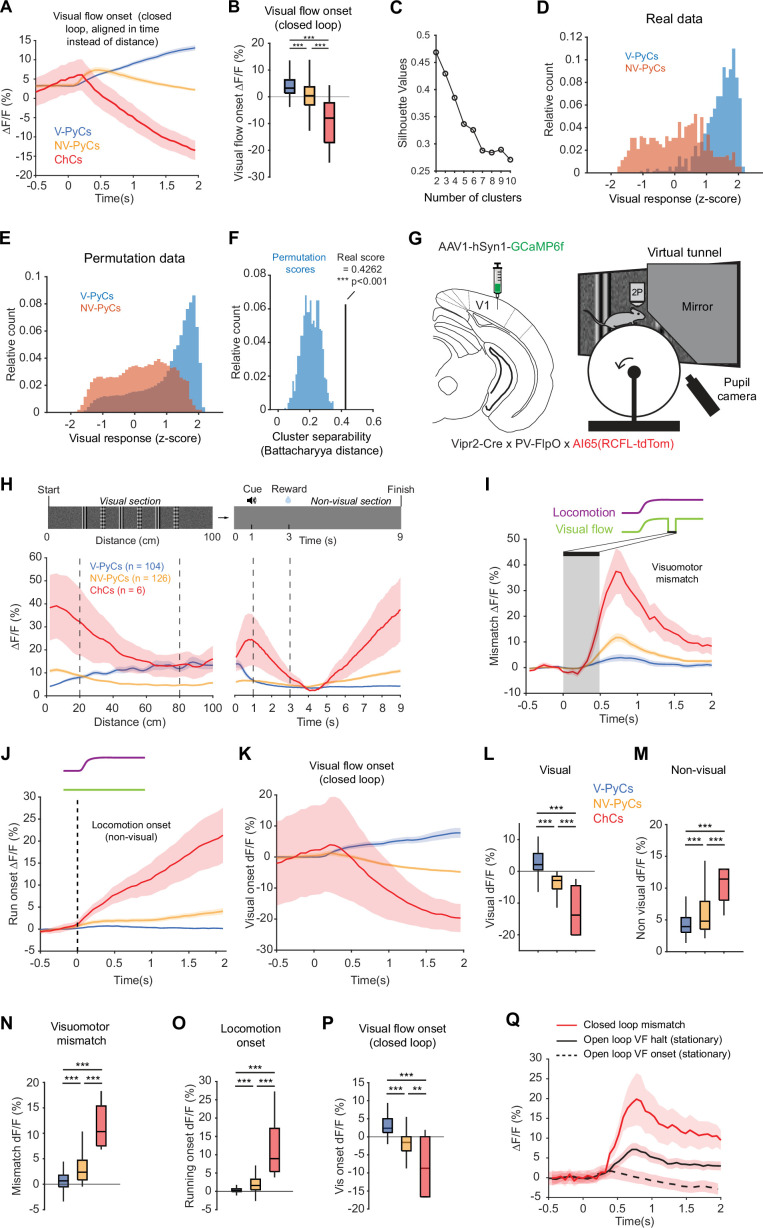
Figure 4—figure supplement 1. Open loop and PV+ chandelier cell (ChC) responses.

Figure 4—figure supplement 1.

(A) Average population activity during visual flow onset in closed loop experiments from Figure 4. Traces are aligned to start of the tunnel rather than distance along the tunnel. Traces represent mean ± SEM over neurons. (B) Average activity during visual flow onset in closed loop. LMEM-Tukey for all comparisons, ***p<0.001. Box plots represent median, quantiles, and 95% confidence interval (CI) over neurons. (C) Silhouette analysis of PyC clustering. Clustering with a cluster number of two resulted in highest silhouette values. (D) Histogram distributions of visual response magnitude for V-PyCs and NV-PyCs on the real data from Figure 4. Responses were calculated by averaging activity between 20 and 80 cm on z-scored traces over the entire virtual tunnel. (E) Histogram distributions as described in D, but for permutation data. Visual responses were calculated as in D, but on traces obtained from shuffling the visual and non-visual section traces across neurons. (F) Histogram showing the cluster separability calculated as Battacharyya distance for the permutation data (blue histogram) and the real distribution (black line). Real separability is higher than expected by chance. Permutation test, ***p<0.001. (G) Schematic of approach for PV+ ChCs. ChCs were identified using Cre- and Flippase-dependent expression of tdTom (AI65 mouse line) in Vipr2-Cre × PV-FlpO mice. (H) Average population traces of visually responsive pyramidal cells (V-PyCs), non-visually responsive pyramidal cells (NV-PyCs), and ChCs in the visual (left) and non-visual (right) part of the tunnel (230 PyCs and 6 ChCs, 2 sessions from 2 mice). PV+ ChCs follow the activity profile of NV-PyCs. (I) Average population traces during visuomotor mismatch events. (J) Average population traces at locomotion onset in the non-visual part of the tunnel. (K) Average population traces during visual flow onset in closed loop experiments. Traces are aligned to start of the tunnel rather than distance along the tunnel. (L) Average activity during visual stimuli (20–80 cm) compared to start of tunnel (0–20 cm). (M) As in L, but for activity in the entire non-visual part of the tunnel. (N) As in L, but for visuomotor mismatch events. (O) As in L, but for locomotion onset events. (P) As in L, but for visual flow onset events. (Q) Average population traces comparing closed loop mismatch with open loop VF halt and open loop VF onset when the mice were stationary (related to Figure 4).