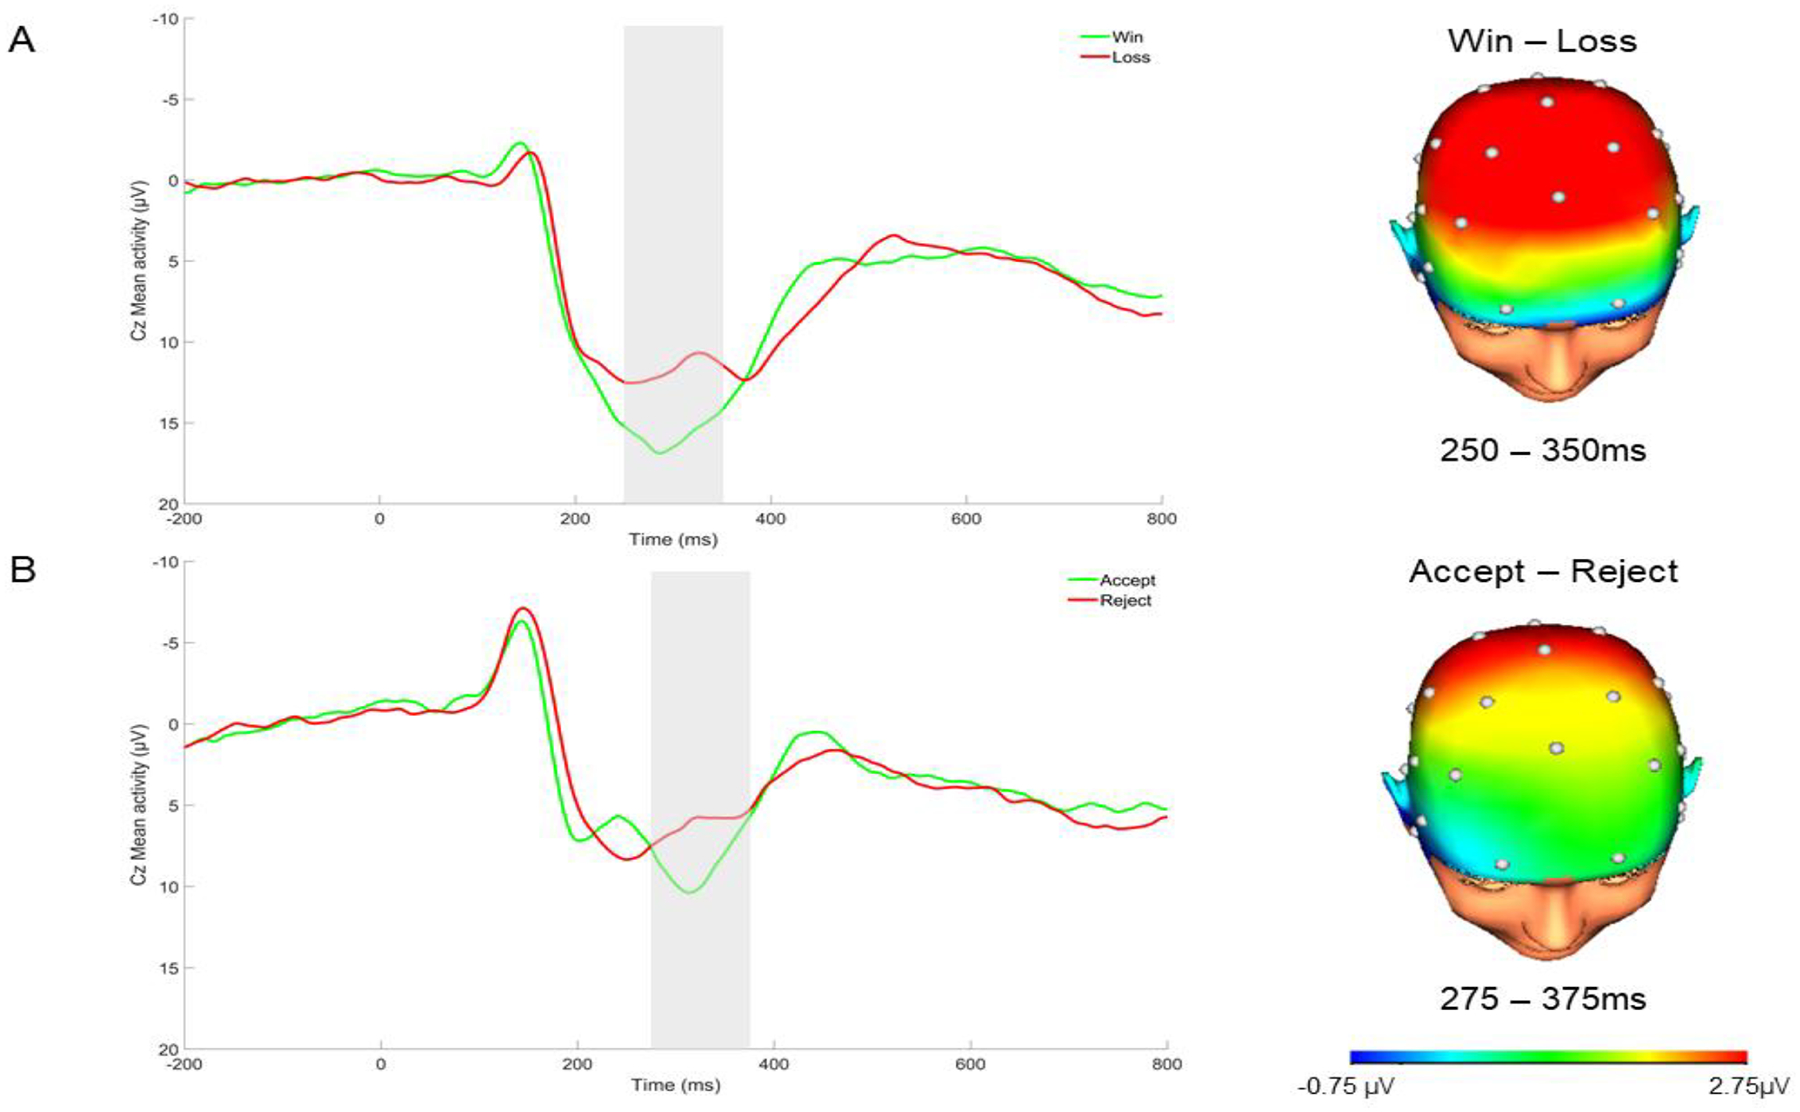
Figure 1.

ERP Waveform and Scalp Distributions Depicting Neural Responses to Monetary (A) and Social (B) Feedback in the Full Sample
Note. ERP waveform is at Cz. The 250–350 ms time window is highlighted in the ERP waveform representing the RewP in the monetary reward task (A), while the 275–375 time window is highlighted in the ERP waveform representing the RewP in the social reward task (B). Negative values are plotted up. Scalp distributions reference the respective RewP time window identified for each task.
