

Abstract
Background.
Delineation of T cell genes, gene sets, pathways, and T cell subtypes associated with acute T cell–mediated rejection (TCMR) may improve its management.
Methods.
We performed bulk RNA sequencing of 34 kidney allograft biopsies (16 Banff TCMR and 18 No Rejection [NR] biopsies) from 34 adult recipients of human kidneys. Computational analysis was performed to determine the differential intragraft expression of T cell genes at the level of single-gene, gene set, and pathways.
Results.
T cell signaling pathway gene sets for plenary T cell activation were overrepresented in TCMR biopsies compared to NR biopsies. Heightened expression of T cell signaling genes was validated using external TCMR biopsies. Pro- and anti-inflammatory immune gene sets were enriched, and metabolism gene sets were depleted in TCMR biopsies compared to NR biopsies. Gene signatures of Treg, Th1 cells, Th2 cells, Th17 cells, Tfh cells, CD4 tissue-resident memory (TRM) T cells, and CD8 TRM T cells were enriched in TCMR biopsies compared to NR biopsies. T-cell exhaustion and anergy were also molecular attributes of TCMR. Gene sets associated with antigen processing and presentation, and leukocyte transendothelial migration were overexpressed in TCMR biopsies compared to NR biopsies. Cellular deconvolution of graft infiltrating cells by gene expression patterns identified CD8 T cell to be the most abundant T cell subtype infiltrating the allograft during TCMR.
Conclusion.
Our delineation of intragraft T cell gene expression patterns, in addition to yielding new biological insights, may help prioritize T cell genes and T cell subtypes for therapeutic targeting.
Introduction
Kidney transplantation is the treatment of choice for most patients with end-stage kidney failure, but an episode of acute T cell–mediated rejection (TCMR) shortens allograft survival and undermines its benefits.1–5
Histology is the reference standard for allograft rejection but limitations in its interpretation exist. Molecular interrogation of biopsies may complement histological evaluation and improve understanding of mechanisms of rejection. The Strom laboratory and we identified heightened expression of mRNAs encoding cytolytic molecules and cytokine in the rejecting human kidney allografts.6–10 The Sarwal team utilized the Stanford cDNA microarrays to interrogate allografts and reported molecular heterogeneity in kidney allografts undergoing acute rejection.11 Additional studies, using microarrays, have characterized intragraft gene expression patterns and have improved our understanding.12–14
RNA-Seq is a powerful molecular tool to analyze gene expression precisely and has several advantages over microarray including a higher resolution, better range of detection, and lower technical variability.15–17 We performed RNA sequencing (RNA-Seq) of human kidney allograft biopsies classified as TCMR or no rejection (NR). Herein, we focused on T cell immunity associated with TCMR whereas our earlier RNA-Seq of human kidney allografts characterized the innate immunity landscape of TCMR.18 Moreover, we performed bioinformatics to analyze intragraft expression not only at the single gene level but also at the gene set and pathway levels since such deeper analyses are conducive to yielding biological insights. We deduced intragraft enrichment of T cell subset signatures informed by KEGG knowledgebase,18 the Reactome database,19 single-cell RNA-Seq data, and pertinent publications, using bioinformatic tools including ROAST (rotation gene set testing), a statistically robust test for gene set and pathway analysis that applies empirical Bayes t-statistics and minimizes issues related to small sample size20 and CAMERA (correlation adjusted mean rank gene set test) for gene set and pathway analysis that adjusts for intergene correlation and controls for type 1 error.21
Materials and Methods
Study Population
We studied 34 kidney transplant recipients (Table S1A). All 18 patients with NR biopsies and 12 of 16 with TCMR biopsies received induction with antithymocyte globulin (P=0.04, Fisher’s exact test). Maintenance immunosuppression was similar. Tacrolimus trough concentration at the time of biopsy was lower in TCMR vs NR (P=0.005, Mann-Whitney test). All TCMR biopsies were for cause, and the NR biopsies were for surveillance (P=0.0001, Fischer’s exact test). We did not include subclinical TCMR biopsies. Serum creatinine at the time of biopsy was 2.55 mg/dL in the TCMR group and 1.34 mg/dL in the NR group (median, P<0.0001, Mann Whitney test).
Kidney Allograft Biopsies
Percutaneous needle biopsies were classified and graded by our 2 transplant pathologists (S.S and S.V.S) using the Banff 2017 update of the Banff ‘97 classification of allograft pathology.22,23 All 34 biopsies were adequate and stained negative for complement component C4d and SV40 large T antigen (Table S1B).
Bulk RNA-Seq
At the time of the biopsy, a portion of the biopsy tissue was immersed in RNAlater and stored at −80°C for subsequent batch processing. Total RNA was isolated from the biopsies using the miRNeasy mini kit (Table S1C). We used TruSeq sample preparation kit v2 (Illumina, Inc., San Diego, CA) to prepare individual cDNA libraries. RNA-Seq was performed on a HiSeq 2500 or HiSeq 4000 sequencer (Illumina, Inc., San Diego, CA). Data processing of all samples used the same analysis pipeline (Supplemental Methods and Table S1D).
External Validation
We used human kidney allograft biopsy gene expression data (analyzed by microarray) in the public repository (GSE36059) for external validation.
Study Approval
Weill Cornell Medicine Institutional Review Board approved the study. Kidney transplant recipients provided written informed consent. The clinical and research activities are consistent with the Declaration of Helsinki24 and the Declaration of Istanbul.25
RNA-Seq Data Availability
We have submitted the RNA sequence datasets to the National Center for Biotechnology Information’s Gene Expression Omnibus, https://www.ncbi.nlm.nih.gov/gds/, accession number GSE131179.
Results
Differential Expression of Genes in Human Kidney Allograft Biopsies
Figure 1 is a schema of our experimental approach. edgeR analysis identified that 2169 of the 16 380 protein-coding genes were differentially expressed between TCMR and NR biopsies (Figure 2A and Table S2A–B).
Figure 1. Framework for intragraft gene expression analysis at the level of single genes, gene sets, and pathways.

Differential gene expression analysis of RNA-Seq data was performed using the limma package in R. Gene set enrichment was determined through Fast Gene Set Enrichment Analysis (fgsea). R packages Generally Applicable Gene-Set Enrichment (GAGE), limma, and pathview were used for gene set or pathway analysis. Rotation gene set test (ROAST) and competitive gene set test for intergene correlation (Camera) were used to analyze gene set signatures. Graft infiltrating T cell subsets were deconvolved using CIBERSORTx LM22 signature matrix, KTB18 signature derived from single-cell RNA sequencing of kidney allografts, and a marker-based deconvolution analytical tool. CIBERSORTx, in addition to estimating the fractions of the different cell types, cell type-specific gene expression profiles at the sample level are feasible and the algorithm incorporates batch correction specific to RNA seq data. Gene expression sets identified by single-cell RNA sequencing were used to detect CD8 T resident memory cells and CD4 T resident memory cells in the biopsies.
Figure 2. Differential expression of genes in human kidney allografts with and without TCMR.

Thirty-four human kidney allograft biopsy specimens from 34 unique kidney allograft recipients were bulk RNA sequenced and analyzed for differential intragraft gene expression between TCMR biopsies (n=16) and NR biopsies (n=18). (A) Volcano plot depicts the relationship between fold change and the nominal (unadjusted) P-value. Differential gene expression analysis was performed using edgeR. Each dot in the volcano plot represents a single mRNA. Log2(Fold Change) value of 0 on the X-axis is equivalent to no difference in gene expression between TCMR and NR (TCMR gene count/NR gene count=1). 1675 genes were expressed in higher abundance (mRNA abundance reported as fragments per kilobase of exon per million reads mapped [FPKM]) in TCMR biopsies compared to NR biopsies and 494 genes were expressed at lower abundance in TCMR biopsies than in NR biopsies. See Table S1 for the list of DEGs ordered by P-FDR. (B) Top 15 Reactome enriched pathways in TCMR based on the upregulated 1675 DEGs. Table S1C lists the Reactome IDs, gene count, and statistical parameters for each pathway. (C) Top 15 Reactome depleted pathways in TCMR biopsies based on the downregulated 494 DEGs. Table S1D lists the Reactome IDs, gene count, and statistical parameters for each pathway. (D) Differential gene expression analysis based on Kyoto Encyclopedia of Genes and Genomes (KEGG) 5 major molecular processes shows that 49% of the 322 pathways of the KEGG 5 molecular processes are differentially expressed between the TCMR biopsy group and the NR biopsy group. Gene set enrichment analysis by GAGE (Generally Applicable Gene-set Enrichment) tests were performed to investigate whether specific gene sets are significantly differentially expressed (each TCMR biopsy vs all NR biopsies) relative to the background whole gene set of 16 380 genes that we identified by RNA-Seq. A rank-based 2-sample T-test (equivalent to the nonparametric Mann-Whitney test) was used. For each gene set, a global P value is derived on a metatest on the negative log sum of all P values from the individual TCMR vs NR comparisons. The stat mean shown in Figure 2D is the mean of the individual statistics from multiple gene set tests. Its absolute value measures the magnitude of gene-set level changes, and its sign indicates the direction of the changes (positive: upregulated in TCMR, negative: downregulated in TCMR). The q value is the false discovery rate adjustment, by the Benjamini-Hochberg method, on the global P value. Table S2 is a list of differentially expressed genes in each of 322 pathways.
Figure 2B and Table S2C–D shows the top enriched 15 Reactome pathways based on the 1675 upregulated genes. Figure 2C shows the top depleted 15 Reactome pathways based on the 494 downregulated genes in TCMR biopsies. Among the 16 TCMR biopsies, 8 were Banff IA and 8 were Banff 1B. The topmost depleted Reactome pathway “Metabolism of amino acids and Derivatives” (R-HSA-71291) was depleted more in TCMR 1B vs 1A biopsies but the topmost enriched Reactome pathway “Immunoregulatory interactions between a Lymphoid cell and a non-Lymphoid cell” (R-HSA-198933) was not different between TCMR 1A vs 1B biopsies (Figure S1 and Table S3).
Figure 2D is a summary of our analysis based on KEGG’s major molecular processes. Differentially expressed genes (DEGs) based on edgeR and differential expression at gene set level based GSEA are also shown in Figure 2D. KEGG Human Diseases process that includes the allograft rejection pathway gene set was the most overexpressed gene set and the metabolism pathway gene set was most depleted in TCMR compared to NR biopsies. Table S4 is a comprehensive analysis of the 322 KEGG pathways of the major molecular processes listed in Figure 2D.
Expression of KEGG T cell Receptor Signaling Pathway Genes in Allograft Biopsies
Figure 3A shows the higher abundances of the mRNAs for CD3D, CD3E, CD3G, and CD247 in TCMR vs NR, and Figure 3B shows the higher abundances of mRNAs for CD4, CD8A, and CD8B in TCMR vs NR.
Figure 3. Intragraft expression of T-cell receptor signaling pathway genes and gene sets.

(A) Boxplots of intragraft abundance of T-cell CD3D mRNA, CD3E mRNA, CD3G mRNA, and CD274 mRNA in TCMR biopsies (orange: TCMR [N=16]; green: NR [N=18]). mRNA abundance is reported as fragments per kilobase of exon per million read mapped (FPKM). The fold change (FC) values shown below each mRNA and the P-FDR were calculated using edgeR. (B) Boxplots of intragraft abundance of CD4 mRNA, CD8A mRNA, and CD8B mRNA in TCMR biopsies (orange: TCMR [N=16]; green: NR [N=18]). (C) Heatmap visualization of hierarchical clustering analysis of 43 KEGG T cell antigenic signaling (signal 1) pathway genes differentially expressed in TCMR biopsies vs NR biopsies. See Table S3A for all 73 genes of the KEGG signal 1 pathway genes. (D) Heatmap visualization of hierarchical clustering analysis of 14 KEGG T cell costimulation (signal 2) pathway genes differentially expressed in TCMR biopsies vs NR biopsies. See Table S3B for all 27 genes of the KEGG signal 2 pathway genes.
We queried DEGs in the KEGG TCR signaling pathway (hsa04660). Table S5A is a list of the 73 genes included in the KEGG signal 1 gene set; 43 of the 73 genes were overexpressed and only 3 were underexpressed significantly in TCMR biopsies. Clustering based on DEGs is shown in Figure 3C. Differential expression of signal 1 genes resulted in biopsy diagnosis-based clustering except for 3 TCMR biopsies (A1, A4, and A13). Table S5B is a list of KEGG T cell costimulation gene sets and 14 of the 27 genes were upregulated significantly in TCMR biopsies. Clustering based on the DEGs showed biopsy diagnosis-based clustering except for the same 3 TCMR biopsies (A1, A4, and A13) and an additional TCMR biopsy (A10) that clustered with NR biopsies (Figure 3D).
We used ROAST20 and CAMERA21 to determine whether gene sets are differentially expressed between TCMR biopsies and NR biopsies. ROAST involves rotation, a Monte Carlo method, for multivariate regression and CAMERA estimates and incorporates the variance inflation factor associated with intergene correlation. Both analyses adjust for sample size. Figure 3E shows that both signal 1 and costimulation gene sets are differentially expressed in TCMR compared to NR biopsies using these 2 robust statistical tools.
T Cell Signaling Signature is Diagnostic of TCMR in an External Biopsy Set
We performed DEG analysis in the GSE36059 microarray data set using limma as provided in the R script. Of the 35 samples designated as TCMR in GSE36059, we included 20 that carried a histological diagnosis of TCMR and excluded 15 that were histologically designated as NA. We randomly selected 20 histologically confirmed NR samples as controls from the 188 samples with nonborderline and non-NA histology. We examined whether the T cell signaling genes (46 signal 1 genes and 14 Signal 2 genes) differentially expressed in our study are also differentially expressed in the GSE36059 microarray data set. Table S6A shows that 50 of the 60 genes associated with TCMR biopsies in our study discriminated TCMR biopsies from NR biopsies in the GSE38059 external TCMR biopsy set.
Validation of External TCMR Genes in Cornell TCMR Biopsy Set
We determined whether microarray identified TCMR classifier14 is reproducible in our biopsies profiled by RNA-Seq. Among the 30 genes included in the TCMR classifier, 1 was miRNA-155, and 2 genes weren’t annotated.14 All remaining 27 genes, identified as TCMR classifier, were significantly overexpressed in our TCMR vs NR biopsies (Table 6B). Our use of an external validation set serves to allay concerns regarding the reproducibility of published data.26,27
Expression of Treg, Th1, Th2, Th17, and Tfh Gene Signatures in Allograft Biopsies
We determined whether T cell subset gene signatures are enriched in TCMR vs NR biopsies. KEGG knowledgebase, scRNA-Seq data, or published T cell subset gene signatures aided our bioinformatics.28–30 Table S7A–D lists the intragraft abundance, FC, nominal P, and P-FDR values for Treg genes, Th1 and Th2 genes, Th17, and Tfh genes.
Figure 4, cumulative distribution function (CDF) plots, show that the ratio of the abundance of Treg genes in the TCMR to the abundance of the Treg genes in NR (Figure 4A), the ratio of the abundance Th1, Th2, or Th17 genes (Figure 4B), and the ratio of the abundance Tfh genes in TCMR to corresponding genes in NR (Figure 4C) are significantly different from the ratio of the abundance of 3695 housekeeping genes31 in TCMR and the corresponding genes in NR. Gene set enrichment using FGSEA identified that the Treg gene set (Figure 4D), Th1 gene set (Figure 4E), Th2 gene set (Figure 4F), Th17 gene set (Figure 4G), and Tfh gene set (Figure 4H) are significantly enriched in the up direction in TCMR vs NR biopsies. We also found a strong positive association between the Th1 and Th2 differentiation Gage stat.mean and the TCR signaling Gage stat.mean (Figure 4I) and between the Th17 differentiation Gage stat.mean and TCR signaling Gage stat.mean (Figure 4J).
Figure 4. Intragraft expression Treg, Th1, Th2, Th17, and Tfh genes and gene sets.

(A) CDF plot of the ratio of the abundance of Treg cell genes in TCMR biopsies and their abundance in NR biopsies (Red line). The blue line represents the CDF of the ratio of the abundance of 3695 ubiquitously expressed housekeeping genes in TCMR to NR biopsies. The right shift of the red line indicates the significantly increased expression of Treg genes in TCMR biopsies vs NR biopsies (D=0.704, p-value=1.85e-13, 2-tailed Kolmogorov-Smirnov test). (B) CDF plots of the ratio of the abundances of Th1 cell genes, Th2 genes, and Th17 cell genes in TCMR biopsies to the abundances of corresponding genes in NR biopsies. The right shift of the lines compared to the blue line of the housekeeping genes indicates the significantly increased expression of Th1 genes in TCMR biopsies vs NR biopsies (D=0.242, p-value=0.03), Th2 cell genes in TCMR biopsies vs NR biopsies (D=0.501, p-value = 2.89e-06), and Th17 cell genes in TCMR biopsies vs NR biopsies (D=0.622, p-value=8.94e-08). (C) CDF plots of the ratio of the abundances of Tfh cell genes in TCMR biopsies to the abundances of corresponding genes in NR biopsies. The right shift of the line compared to the blue line of the housekeeping genes indicates the significantly increased expression of Tfh genes in TCMR biopsies vs NR biopsies (D=0.704, p-value=8.53e-13). (D-H) Fast Gene Set Enrichment Analysis (FGSEA) plots of Treg (D), Th1 (E), Th2 (F), TH17 (G), and Tfh (H) genes. (I-J) KEGG pathway GAGE enrichment means (stat-mean) of Th1/Th2 (I) and Th17 cell differentiation (J) against the “statmean” of the T cell receptor signaling pathway genes. The stat mean is the mean of the individual statistics from multiple gene-set tests. Normally, its absolute value measures the magnitude of gene-set level changes, and its sign indicates the direction of the changes. See Table S7 for Treg gene list (7A), Th1 and Th2 gene list (7B), Th17 gene list (7C), and Tfh gene list (7D).
Expression of Tissue Resident Memory T Cell Gene Signatures in Allograft Biopsies
To further define T cell subsets infiltrating the allograft during TCMR, we determined intragraft expression of the gene signature of CD8-tissue resident memory T (CD8 TRM) cells and the gene signature of CD4 TRM cells. The gene signatures were based on scRNA-Seq data of tumor-infiltrating T cells.32 Table S8 lists the intragraft abundance for CD8 TRM T cell gene set (Table S8A) and CD4 TRM T cell gene set (Table S8B).
Figure 5A, CDF plots, show that the ratio of CD8 TRM T cell genes abundance in the TCMR to the abundance of the corresponding genes in NR, and the ratio of CD4 TRM T cell genes in TCMR to the corresponding genes in NR are significantly different from the ratio of 3695 housekeeping genes in TCMR and NR. Moreover, the CD8 TRM T cell genes were enriched compared to the CD4 TRM T cell genes in TCMR. Figure 5B, GSEA, shows significant enrichment in TCMR of the 47 gene signature of CD8 TRM T cells and the 48 gene signature of CD4 TRM T cells. CD8 TRM T cell subset expresses mRNAs for cytolytic molecules perforin and granzymes. Our analysis identified that the abundance of mRNAs for granzymes and perforin is higher in TCMR vs NR biopsies (Figures 5C–D).
Figure 5. Intragraft expression CD8 tissue-resident memory T cell genes and gene set and CD4 tissue-resident memory T cell genes and gene set.
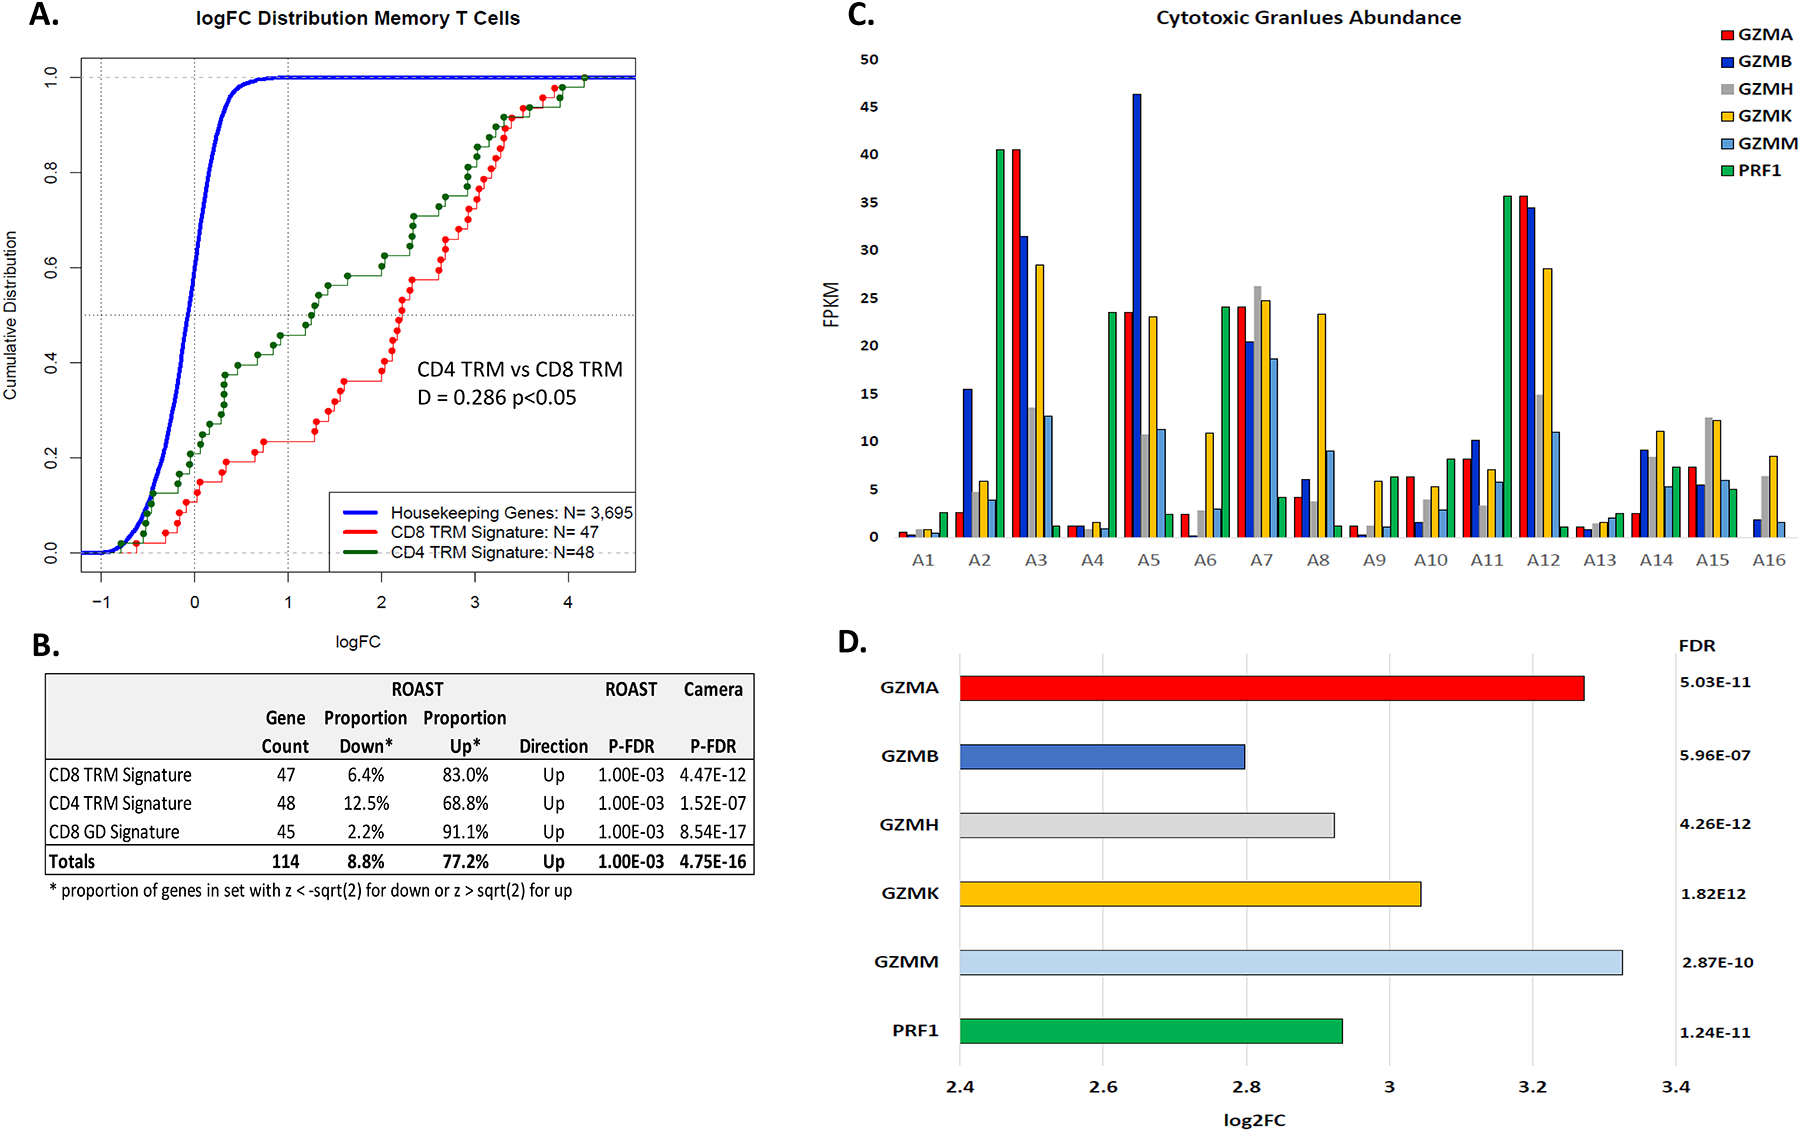
(A) CDF plot of the ratio of the abundance of the 47 CD8 TRM T cell genes in TCMR biopsies to NR biopsies (red line) and the CDF plot of the ratio of the abundance of the 48 CD4 TRM T cell genes in TCMR biopsies to NR biopsies (green line). The blue line represents the CDF of the ratio of the abundance of 3695 ubiquitously expressed housekeeping genes in TCMR to NR biopsies. The right shift of the red and green lines, compared to the blue line, indicates the significantly increased expression in TCMR biopsies vs NR biopsies of the CD8 TRM T cell genes (D = 0.801, p-value = 2.2E-16, 2-tailed Kolmogorov-Smirnov test) and the CD4 TRM T cell genes (D = 0.642, p-value = 2.2E-16). The ratio of the CD8 TRM T cell genes was also significantly different from the ratio of the CD4 TRM cell genes (D = 0.286, p-value = 0.0286). (B) Gene signature testing using ROAST and Camera showed that the CD8 TRM T cell gene signature and the CD4 TRM T cell gene signature is different significantly between TCMR biopsies and NR biopsies. (C) Intragraft abundance of mRNAs for granzymes (GZM) and perforin (PRF1) mRNA in each TCMR biopsy, and (D) Higher intragraft abundance of mRNAs for granzymes and perforin mRNA in the TCMR biopsy group vs NR biopsy group. Log2FC and P-FDR of GZMA, GZMB, GZMH, GZMK, GZMM, and PRF1 from edgeR analysis are shown.
Expression of Inhibitory Receptor, Anergy, and Exhaustion Gene Sets in Allograft Biopsies
We investigated intragraft expression of genes encoding inhibitory receptors and genes associated with exhaustion and anergy.33–35 Table S9 lists the intragraft abundance for the genes associated with inhibitory receptor genes, exhaustion, and anergy. Thirteen of the 16 genes encoding the inhibitory receptors, 21 of the 23 genes associated with exhaustion, and 12 of the 23 genes linked to anergy are overexpressed significantly in TCMR vs NR. Heatmap visualization of heightened expression in TCMR biopsies of the genes associated with T cell exhaustion, anergy, and genes encoding inhibitory receptors is shown in Figure 6A. Analysis at the gene sets level involving ROAST and CAMERA showed significant enrichment of the gene set for the inhibitory receptors, the gene set associated with exhaustion and the gene set associated with anergy (Figure 6B). GSEA yielded an adjusted P value of 1.08E-04 and NES=2.07 (Figure 6C).
Figure 6. Intragraft expression inhibitory receptor, anergy, and exhaustion genes and gene sets.

(A) Heatmap of the intragraft abundance of mRNA encoding T-cell inhibitory receptor proteins linked to T-cell anergy and exhaustion. See Table S7 for the 62 gene list and DEGs by edgeR. (B) ROAST and Camera statistics for the T-cell inhibitory receptor gene set (5.00E-04 and 1.05E-07, respectively), T-cell anergy gene set (5.00E-04 and 3.08E-05, respectively), and exhaustion marker gene set (5.00E-04 and 6.75E-10, respectively) demonstrate higher abundance in TCMR biopsies compared to NR biopsies. (C) Enrichment (fgsea) of all 62 inhibitory receptors, anergy, and exhaustion genes in TCMR biopsies vs NR biopsies (adjusted P=1.08E-04, NES:2.07).
Intragraft Expression of Genes Associated with Antigen Processing and Presentation
We determined intragraft expression of KEGG MHC class I and MHC class II antigen processing and presentation pathway genes (hsa04612). Of the 26 KEGG MHC class I genes expressed in the kidney allograft, 16 were significantly overexpressed and 2 were significantly underexpressed in TCMR vs NR biopsies (Figure 7A, Table S10A). Of the 26 KEGG MHC class II genes, 19 were significantly overexpressed and 1 was significantly underexpressed in TCMR vs NR biopsies (Figure 7A, Table S10B).
Figure 7. Intragraft Expression of Major and Autosomal Minor Histocompatibility Antigen Genes.

(A) Heatmap of major histocompatibility antigen I and II KEGG pathway genes. Differentially expressed genes at P-FDR <0.05 are shown. (B) Heatmaps of autosomal minor histocompatibility antigen KEGG pathway genes. Differentially expressed genes at P-FDR <0.05 are shown.
Autosomal minor histocompatibility antigens (mHAgs) are polymorphic cell-derived self-peptides coded by diallelic autosomal genes. mHAgs displayed on the cell surface by HLA are recognized by HLA class I–restricted CD8+ T cells or by HLA class II–restricted CD4+ T cells. Of the 51 mHAgs with polymorphic sites,36 25 were differentially expressed with 21 significantly overexpressed and 4 significantly underexpressed in TCMR biopsies vs NR biopsies (Figure 7B, Table S10C).
Intragraft Expression of Genes Mapped to Leukocyte Transendothelial Migration Machinery
We determined intragraft expression patterns of KEGG transendothelial migration (TEM) pathway genes (hsa04670). Of the 100 KEGG TEM pathway genes detected in the biopsies, 38 were leukocyte migration signature genes and 23 of the 38 were differentially expressed with all but 1 showing higher abundance in TCMR vs NR biopsies. Of the 62 endothelial cell signature genes, 24 were differentially expressed with increased abundance of 19 of 24 genes in TCMR (Figure 8A and Table S11). Figure 8B shows that CDF plots of leukocyte (D=0.531, P=1.23e−09) and endothelial cell signature genes (D=0.343, P=1.22e−06) differentially expressed between TCMR and NR.
Figure 8. Intragraft Expression of Genes Involved in Leukocyte Transendothelial Migration Machinery.

(A) Heatmap of KEGG leukocyte transendothelial migration pathway genes stratified as leukocyte cell genes and endothelial cell genes. (B) CDF plot of the ratio of the abundance of leukocyte (red) and endothelial cell (green) genes in TCMR biopsies to NR biopsies. The blue line represents the CDF of the ratio of the abundance of 3695 ubiquitously expressed housekeeping genes in TCMR to NR biopsies.
One more. No need
Resolving Intragraft T Cell Subtypes by Cellular Deconvolution
We applied CIBERSORTx37 for the deconvolution of cell types infiltrating the kidney allograft. We used 2 signature matrices—the LM22 signature derived from peripheral blood mononuclear cells38 and the KTB18 signature derived from single-cell sequencing of kidney allografts.39 The absolute scores of CD4 memory T cells, CD8 T cells, Treg, and Tfh were significantly higher in TCMR vs NR biopsies using the LM22 signature matrix (Figure 9A). The absolute scores of CD4 naïve cells, CD4 memory T cells, CD8 effector cells, and CD8 TEMRA were significantly higher using the KTB18 signature matrix (Figure 9B).
Figure 9. Graft infiltrating T cell subset fractions in TCMR and NR Biopsies.

In Panels A and B, the 18 630 RNA-seq gene expression count matrix was deconvolved using the CIBERSORTx and 2 different signature matrices. (A) The LM22 signature matrix38 was used as the reference base matrix to infer the proportion of T cell subsets. The LM 22 signature matrix consists of 547 genes discriminatory of the 22 hematopoietic cell populations. Among the 7 T cell populations included in LM 22 matrix, the fractions of 4 T cell subsets were significantly different between TCMR biopsies and NR biopsies. Fractions in each biopsy is shown in the Box plots. (B) the KTB18 signature matrix derived from single-cell RNA sequencing of kidney allografts39 was applied as the reference base matrix for deconvolution. The fractions of T cell subsets included in the KTB18 signature matrix that were significantly different between TCMR biopsies and NR biopsies are shown. The absolute score on the Y-axis is estimated as the median expression level of all genes in the signature matrix divided by the median expression level of all genes in the biopsies. The algorithm uses this score to scale the relative cell fractions to absolute abundances. The Wilcoxon test was adjusted for multiple comparisons with Bonferroni to analyze differences in immune cell fractions between TCMR and NR biopsies. (C) A marker-based deconvolution with markers (genes) from the following sources: (i) Azimuth (https://azimuth.hubmapconsortium.org/); (ii) KEGG pathways; and (iii) Tan et al65 was used to analyze graft infiltrating T cell subsets. The color in each cell reflects the level of expression of the T cell subset-specific gene set in a sample relative to the geometric mean expression (FPKM) of the gene set in the entire set of biopsy samples. The scale reflects the abundance of the ratio. Wilcoxon test adjusted for multiple comparisons with Bonferroni was used to calculate the P values.
In addition, our marker-based cellular deconvolution identified significantly higher proportions of T cells, CD4 naïve cells, proliferating cells, effector memory cells, central memory cells, Treg, Th1, Th2, Th17, Tfh cells, and CD8 naïve cells, proliferating cells, central memory cells and effector memory cells in TCMR biopsies vs NR biopsies (Figure 9C).
Discussion
To organize and interpret global alterations in gene expression associated with TCMR, we performed analysis of DEGs at the single gene, gene set, and pathway levels. Our approach—RNA-Seq and robust computational methods to analyze gene expression patterns, in addition to deciphering the T cell gene landscape of TCMR, yielded biological insights about TCMR in human kidney allografts. Importantly, by analyzing the pathways in human tissues, we provide direct evidence and validation of manually drawn pathways (eg, KEGG Pathway) used extensively for bioinformatics analysis.
Earlier profiling studies of kidney allografts have analyzed the DEGs primarily at the single-gene level.11,13,14,40–42 Our analyses at the gene set and pathway levels are complementary to analysis at the single gene level in resolving subtle and coordinated variations in related genes in a biological pathway.43,44 Our approach however cannot resolve the cellular source or the topology for the extensive alterations in gene expression patterns. Single-cell RNA-Seq, spatial transcriptomics, and a multiomics approach should help deeper interrogation of the allograft and yield additional insights.
We identified that not only proinflammatory pathway gene sets, but also anti-inflammatory pathway gene sets are overrepresented in TCMR biopsies. For example, both positive signaling molecules CD3 complex and CD247 and negative signaling molecules such as CTLA4 and PDCD1 were overexpressed in TCMR. Likewise, gene for proinflammatory NFKB and the gene for the anti-inflammatory IKBKB were overexpressed in TCMR. Together, our findings support the concept that the immune repertory during TCMR is not monotonic and is associated with counterregulatory mechanisms. An antirejection approach that blocks proinflammatory pathways but preserves anti-inflammatory pathways may help better manage TCMR refractory to treatment.5,45 Our finding that metabolic pathways are depleted in TCMR is likely due to severe cellular stress.18 We hypothesize that rectification of dysregulated metabolism may help kidney allograft recovery from an episode of TCMR.
T cells are prime mediators of TCMR.46–48 Our identification of overexpression of gene sets for T cell antigenic signal and costimulatory in TCMR indicates that the molecular machinery obligatory for full T cell activation49–51 is present within the rejecting allograft. Our transcriptome profiling identified signatures of Treg, Th1, Th2, Th17, and Tfh cells in TCMR. The enriched Treg gene signature is in accord with our earlier finding of FOXP3 mRNA overexpression during an episode of TCMR.52 Th1 cells are considered to promote cellular immunity by secreting IL-2 and IFNG.53 Surprisingly, Th2 and TH17 signatures were more strongly associated with TCMR than Th1 signatures in our study. Whether this reflects greater sensitivity of Th1 cells to currently used immunosuppressive drugs than Th2 and Th17 cells remains to be resolved. The primary focus of the current study is on T cells. In view of Tfh cell signature being enriched in TCMR biopsies, investigation of B cell gene signatures in TCMR biopsies may yield additional insights. We plan to investigate B cell gene signatures in different rejection categories.
TRM T cells differ from naïve T cells in their activation requirements, and sensitivity to conventional immunosuppressives, and have been identified in transplant nephrectomies.54–57 Our findings of enriched gene signatures of CD8 TRM T cells and CD4 TRM T cells in TCMR offer a molecular basis for resistance to antirejection therapy.5,40 Among the TRM T cell gene signatures in TCMR biopsies, the CD8 TRM T cell gene signature was stronger than the CD4 TRM T cell gene signature. Furthermore, the CD4 TRM T cell gene set included negative signaling molecules such as FOXP3 and PDCD1 but the CD8 TRM T cell gene set did not. A pathogenetic role for CD8 T cells in causing kidney parenchymal cell damage is also suggested by the expression of genes encoding cytolytic moieties granzymes, perforin, and fas ligand. Altogether, our novel findings support the hypothesis that CD8 T cells are candidate targets to treat TCMR more effectively and this postulate is also supported by our finding that the fraction of CD8 T cells is the highest among graft infiltrating T cell subsets (Figure 9) and the recent finding from the scRNA-Seq study that CD8 T are the dominant T cell subtype in the rejecting kidney allograft.58 CD8 Treg have been described59 and CD8 targeting therefore should be undertaken with appropriate immune monitoring.
Persistent T cell signaling can result in T cell exhaustion exemplified by gene expression patterns and metabolic alterations.60 Our observations that gene sets associated with T cell exhaustion and anergy are enriched in TCMR portray yet another dimension of T cell gene expression pattern during TCMR. Whether the presence of exhausted T cells within the allograft represents a “stalemate” between the alloreactive T cells and graft parenchymal cells and whether the exhausted T cells could be rejuvenated and contribute to the pool of T cell effectors mediating rejection requires further study. What is clear however is that the absence of rejection is not characterized by a high abundance of genes associated with T cell exhaustion, anergy, or the genes encoding inhibitory receptors.
We identified that all 6 MHC class I genes and B2M mRNA were overexpressed in TCMR. Transporter associated with antigen processing (TAP) is an ATP-binding-cassette transporter family protein that delivers cytosolic peptides into the endoplasmic reticulum where they bind to MHC class I molecules. We found that the abundance of mRNAs for TAP1 and TAP2 was higher in TCMR. Expression levels for IFI30 (GILT) of the endocytosis machinery, and the key MHC class II assembly genes CD74 and CTSS were also higher in TCMR biopsies, and all 11 MHC class II genes were significantly higher. The prevailing paradigm is that antigen processing and presentation occur in the secondary lymphoid organs. Our molecular profiling identifying robust expression of antigen processing and presentation machinery within the rejecting allograft suggests the hypothesis that this critical process may very well occur within the allograft itself.
A histologic hallmark of TCMR is interstitial infiltration resulting from transendothelial migration (TEM) of leukocytes from the peritubular capillaries into the allograft interstitial space. Our elucidation of robust intragraft enrichment of endothelial cell gene signature and leukocyte cell gene signature in TCMR biopsies provides a molecular basis for the interstitial infiltration of the kidney allograft by recipient leukocytes during an episode of TCMR.
The cell-mixture proportions inferred in our study was impacted, as expected, by the reference expression matrix used for the in silico analyses. To minimize limitations associated with deconvolution analysis, we used heterogenous data sets as basic matrices as well as a robust method, CIBERSORTx, for the deconvolution analyses.61–64
Our study has limitations. Versatility/plasticity of T cell subsets could lead to misassignment based on gene expression ascertained at a single time point. Context-dependent functionality of genes is another concern for gene expression studies. Our sample size is relatively small but several features of our study protect against the small sample size; First, we used RNA sequencing which has an unprecedented level of precision.15–17 Second, the DEGs that we report were based on P-FDR—which adjusts for multiple testing minimizing a type I error (false positive); Third, we used ROAST and CAMERA, 2 statistically robust tests for gene set and pathway analysis that minimizes issues related to small sample size.20,21 Nonetheless, our original observations need to be validated by RNA-Seq of kidney allograft biopsies from an independent cohort of kidney allograft recipients. Another limitation of our study is that we have not investigated subclinical rejection (SCR). The detailed molecular features of clinical TCMR and NR from our study should however serve as reference for future studies of SCR.
In sum, using RNA-Seq and robust computational tools, we demonstrate intragraft expression of gene sets, differentiation and signaling pathways of T cell activation, and enrichment of gene signatures of multiple T cell subtypes—Treg, Th1cells, Th2 cells, Th17 cells, Tfh cells, CD8 TRM T cells, and CD4 TRM T cells- within the kidney allograft undergoing TCMR. We demonstrate that TCMR is exemplified by both pro- and anti-inflammatory molecular pathways and metabolic dysregulation; exhaustion and anergy are also molecular attributes of TCMR. Genes encoding antigen processing and presentation and transendothelial migration are overrepresented in TCMR biopsies. Our delineation of intragraft gene expression, in addition to yielding new biological insights, may help prioritize genes and cell types for therapeutic targeting.
Supplementary Material
Financial Disclosure
Supported in part by awards from the NIH to M. Suthanthiran (MERIT Award, R37-AI051652), T. Muthukumar (K08-DK087824), and Weill Cornell Medical College (Clinical and Translational Science Center Award UL1TR000457).
Abbreviations
- CAMERA
Correlation Adjusted Mean Rank Gene Set test
- CD
Cluster of Differentiation
- cDNA
Complementary DNA
- CDF
Cumulative Distribution Function
- DEG
Differential Expression of Genes
- FDR
False Discovery Rate
- FGSEA
Fast Gene Set Enrichment Analysis
- GSEA
Gene Set Enrichment Analysis
- KEGG
Kyoto Encyclopedia of Genes and Genomes
- mRNA
Messenger Ribonucleic Acid
- NR
No Rejection
- RNA-Seq
RNA-Sequencing
- ROAST
Rotation Gene Set Testing
- scRNA-Seq
Single Cell RNA-Sequencing
- TCMR
Acute T Cell–Mediated Rejection
- TCR
T Cell Receptor
- TRM
Tissue Resident Memory
Footnotes
Disclaimer
The authors declare no conflicts of interest.
Author Roles
Designed research: M.S., T.M.
Conducting experiments: H.Y., C.L., C.S., T.M.
Acquiring data: F.B.M., H.Y., C.L., C.S., D.M.D., J.Z.X., V.K.S., T.M.
Analyzing data: F.B.M., H.Y., J.Z.X., S.S., S.V.S., V.K.S., O.E., T.M.
Providing reagents: J.Z.X., M.S.
Writing the manuscript: F.B.M., T.M., M.S.
References
- 1.Hariharan S, Johnson CP, Bresnahan BA, et al. Improved graft survival after renal transplantation in the United States, 1988 to 1996. N Engl J Med. 2000;342(9):605–612. [DOI] [PubMed] [Google Scholar]
- 2.Cole EH, Johnston O, Rose CL, et al. Impact of acute rejection and new-onset diabetes on long-term transplant graft and patient survival. Clin J Am Soc Nephrol. 2008;3(3):814–821. [DOI] [PMC free article] [PubMed] [Google Scholar]
- 3.Alkadi MM, Kim J, Aull MJ, et al. Kidney allograft failure in the steroid-free immunosuppression era: a matched case-control study. Clin Transplant. 2017;31(11). [DOI] [PubMed] [Google Scholar]
- 4.Chaudhry D, Chaudhry A, Peracha J, et al. Survival for waitlisted kidney failure patients receiving transplantation versus remaining on waiting list: systematic review and meta-analysis. BMJ. 2022;376:e068769. [DOI] [PMC free article] [PubMed] [Google Scholar]
- 5.Rampersad C, Balshaw R, Gibson IW, et al. The negative impact of T cell-mediated rejection on renal allograft survival in the modern era. Am J Transplant. 2022;22(3):761–771. [DOI] [PMC free article] [PubMed] [Google Scholar]
- 6.Strehlau J, Pavlakis M, Lipman M, et al. Quantitative detection of immune activation transcripts as a diagnostic tool in kidney transplantation. Proc Natl Acad Sci U S A. 1997;94(2):695–700. [DOI] [PMC free article] [PubMed] [Google Scholar]
- 7.Lipman ML, Stevens AC, Bleackley RC, et al. The strong correlation of cytotoxic T lymphocyte-specific serine protease gene transcripts with renal allograft rejection. Transplantation. 1992;53(1):73–79. [DOI] [PubMed] [Google Scholar]
- 8.Xu GP, Sharma VK, Li B, et al. Intragraft expression of IL-10 messenger RNA: a novel correlate of renal allograft rejection. Kidney Int. 1995;48(5):1504–1507. [DOI] [PubMed] [Google Scholar]
- 9.Sharma VK, Bologa RM, Li B, et al. Molecular executors of cell death--differential intrarenal expression of Fas ligand, Fas, granzyme B, and perforin during acute and/or chronic rejection of human renal allografts. Transplantation. 1996;62(12):1860–1866. [DOI] [PubMed] [Google Scholar]
- 10.Sharma VK, Bologa RM, Xu GP, et al. Intragraft TGF-beta 1 mRNA: a correlate of interstitial fibrosis and chronic allograft nephropathy. Kidney Int. 1996;49(5):1297–1303. [DOI] [PubMed] [Google Scholar]
- 11.Sarwal M, Chua MS, Kambham N, et al. Molecular heterogeneity in acute renal allograft rejection identified by DNA microarray profiling. N Engl J Med. 2003;349(2):125–138. [DOI] [PubMed] [Google Scholar]
- 12.Flechner SM, Kurian SM, Head SR, et al. Kidney transplant rejection and tissue injury by gene profiling of biopsies and peripheral blood lymphocytes. Am J Transplant. 2004;4(9):1475–1489. [DOI] [PMC free article] [PubMed] [Google Scholar]
- 13.Halloran PF, de Freitas DG, Einecke G, et al. The molecular phenotype of kidney transplants. Am J Transplant. 2010;10(10):2215–2222. [DOI] [PubMed] [Google Scholar]
- 14.Venner JM, Famulski KS, Badr D, et al. Molecular landscape of T cell-mediated rejection in human kidney transplants: prominence of CTLA4 and PD ligands. Am J Transplant. 2014;14(11):2565–2576. [DOI] [PubMed] [Google Scholar]
- 15.Wang Z, Gerstein M, Snyder M. RNA-Seq: a revolutionary tool for transcriptomics. Nat Rev Genet. 2009;10(1):57–63. [DOI] [PMC free article] [PubMed] [Google Scholar]
- 16.Zhao S, Fung-Leung WP, Bittner A, et al. Comparison of RNA-Seq and microarray in transcriptome profiling of activated T cells. PLoS One. 2014;9(1):e78644. [DOI] [PMC free article] [PubMed] [Google Scholar]
- 17.Zhang W, Yu Y, Hertwig F, et al. Comparison of RNA-seq and microarray-based models for clinical endpoint prediction. Genome Biol. 2015;16(1):133. [DOI] [PMC free article] [PubMed] [Google Scholar]
- 18.Mueller FB, Yang H, Lubetzky M, et al. Landscape of innate immune system transcriptome and acute T cell-mediated rejection of human kidney allografts. JCI Insight. 2019;4(13):e128014. [DOI] [PMC free article] [PubMed] [Google Scholar]
- 19.Fabregat A, Sidiropoulos K, Viteri G, et al. Reactome pathway analysis: a high-performance in-memory approach. BMC Bioinformatics. 2017;18(1):142. [DOI] [PMC free article] [PubMed] [Google Scholar]
- 20.Wu D, Lim E, Vaillant F, et al. ROAST: rotation gene set tests for complex microarray experiments. Bioinformatics. 2010;26(17):2176–2182. [DOI] [PMC free article] [PubMed] [Google Scholar]
- 21.Wu D, Smyth GK. Camera: a competitive gene set test accounting for inter-gene correlation. Nucleic Acids Res. 2012;40(17):e133. [DOI] [PMC free article] [PubMed] [Google Scholar]
- 22.Racusen LC, Solez K, Colvin RB, et al. The Banff 97 working classification of renal allograft pathology. Kidney Int. 1999;55(2):713–723. [DOI] [PubMed] [Google Scholar]
- 23.Haas M, Loupy A, Lefaucheur C, et al. The Banff 2017 Kidney Meeting Report: revised diagnostic criteria for chronic active T cell-mediated rejection, antibody-mediated rejection, and prospects for integrative endpoints for next-generation clinical trials. Am J Transplant. 2018;18(2):293–307. [DOI] [PMC free article] [PubMed] [Google Scholar]
- 24.World Medical Association. World Medical Association Declaration of Helsinki: ethical principles for medical research involving human subjects. JAMA. 2013;310(20):2191–2194. [DOI] [PubMed] [Google Scholar]
- 25.International Summit on Transplant Tourism and Organ Trafficking. The Declaration of Istanbul on Organ Trafficking and Transplant Tourism. Clin J Am Soc Nephrol. 2008;3(5):1227–1231. [DOI] [PMC free article] [PubMed] [Google Scholar]
- 26.Baker M 1,500 scientists lift the lid on reproducibility. Nature. 2016;533(7604):452–454. [DOI] [PubMed] [Google Scholar]
- 27.McNutt M Reproducibility. Science. 2014;343(6168):229. [DOI] [PubMed] [Google Scholar]
- 28.Pfoertner S, Jeron A, Probst-Kepper M, et al. Signatures of human regulatory T cells: an encounter with old friends and new players. Genome Biol. 2006;7(7):R54. [DOI] [PMC free article] [PubMed] [Google Scholar]
- 29.Zhu J T helper 2 (Th2) cell differentiation, type 2 innate lymphoid cell (ILC2) development and regulation of interleukin-4 (IL-4) and IL-13 production. Cytokine. 2015;75(1):14–24. [DOI] [PMC free article] [PubMed] [Google Scholar]
- 30.Aran D, Hu Z, Butte AJ. xCell: digitally portraying the tissue cellular heterogeneity landscape. Genome Biol. 2017;18(1):220. [DOI] [PMC free article] [PubMed] [Google Scholar]
- 31.Eisenberg E, Levanon EY. Human housekeeping genes, revisited. Trends Genet. 2013;29(10):569–574. [DOI] [PubMed] [Google Scholar]
- 32.Savas P, Virassamy B, Ye C, et al. Single-cell profiling of breast cancer T cells reveals a tissue-resident memory subset associated with improved prognosis. Nat Med. 2018;24(7):986–993. [DOI] [PubMed] [Google Scholar]
- 33.Yi JS, Cox MA, Zajac AJ. T-cell exhaustion: characteristics, causes and conversion. Immunology. 2010;129(4):474–481. [DOI] [PMC free article] [PubMed] [Google Scholar]
- 34.Wherry EJ, Kurachi M. Molecular and cellular insights into T cell exhaustion. Nat Rev Immunol. 2015;15(8):486–499. [DOI] [PMC free article] [PubMed] [Google Scholar]
- 35.Valdor R, Macian F. Induction and stability of the anergic phenotype in T cells. Semin Immunol. 2013;25(4):313–320. [DOI] [PMC free article] [PubMed] [Google Scholar]
- 36.Griffioen M, van Bergen CA, Falkenburg JH. Autosomal minor histocompatibility antigens: how genetic variants create diversity in immune targets. Front Immunol. 2016;7:100. [DOI] [PMC free article] [PubMed] [Google Scholar]
- 37.Newman AM, Steen CB, Liu CL, et al. Determining cell type abundance and expression from bulk tissues with digital cytometry. Nat Biotechnol. 2019;37(7):773–782. [DOI] [PMC free article] [PubMed] [Google Scholar]
- 38.Newman AM, Liu CL, Green MR, et al. Robust enumeration of cell subsets from tissue expression profiles. Nat Methods. 2015;12(5):453–457. [DOI] [PMC free article] [PubMed] [Google Scholar]
- 39.Lamarthee B, Callemeyn J, Van Herck Y, et al. Transcriptional and spatial profiling of the kidney allograft unravels a central role for FcyRIII+ innate immune cells in rejection. Nat Commun. 2023;14(1):4359. [DOI] [PMC free article] [PubMed] [Google Scholar]
- 40.Einecke G, Melk A, Ramassar V, et al. Expression of CTL associated transcripts precedes the development of tubulitis in T-cell mediated kidney graft rejection. Am J Transplant. 2005;5(8):1827–1836. [DOI] [PubMed] [Google Scholar]
- 41.Mueller TF, Einecke G, Reeve J, et al. Microarray analysis of rejection in human kidney transplants using pathogenesis-based transcript sets. Am J Transplant. 2007;7(12):2712–2722. [DOI] [PubMed] [Google Scholar]
- 42.Spivey TL, Uccellini L, Ascierto ML, et al. Gene expression profiling in acute allograft rejection: challenging the immunologic constant of rejection hypothesis. J Transl Med. 2011;9:174. [DOI] [PMC free article] [PubMed] [Google Scholar]
- 43.Garcia-Campos MA, Espinal-Enriquez J, Hernandez-Lemus E. Pathway analysis: state of the art. Front Physiol. 2015;6:383. [DOI] [PMC free article] [PubMed] [Google Scholar]
- 44.Maleki F, Ovens K, Hogan DJ, et al. Gene set analysis: challenges, opportunities, and future research. Front Genet. 2020;11:654. [DOI] [PMC free article] [PubMed] [Google Scholar]
- 45.Bouatou Y, Viglietti D, Pievani D, et al. Response to treatment and long-term outcomes in kidney transplant recipients with acute T cell-mediated rejection. Am J Transplant. 2019;19(7):1972–1988. [DOI] [PubMed] [Google Scholar]
- 46.Suthanthiran M, Strom TB. Renal transplantation. N Engl J Med. 1994;331(6):365–376. [DOI] [PubMed] [Google Scholar]
- 47.Benichou G, Kim J. Editorial: allorecognition by leukocytes of the adaptive immune system. Front Immunol. 2017;8:1555. [DOI] [PMC free article] [PubMed] [Google Scholar]
- 48.Hennessy C, Lewik G, Cross A, et al. Recent advances in our understanding of the allograft response. Fac Rev. 2021;10:21. [DOI] [PMC free article] [PubMed] [Google Scholar]
- 49.Suthanthiran M A novel model for antigen-dependent activation of normal human T cells. Transmembrane signaling by crosslinkage of the CD3/T cell receptor-alpha/beta complex with the cluster determinant 2 antigen. J Exp Med. 1990;171(6):1965–1979. [DOI] [PMC free article] [PubMed] [Google Scholar]
- 50.Bretscher PA. A two-step, two-signal model for the primary activation of precursor helper T cells. Proc Natl Acad Sci U S A. 1999;96(1):185–190. [DOI] [PMC free article] [PubMed] [Google Scholar]
- 51.Nel AE. T-cell activation through the antigen receptor. Part 1: signaling components, signaling pathways, and signal integration at the T-cell antigen receptor synapse. J Allergy Clin Immunol. 2002;109(5):758–770. [DOI] [PubMed] [Google Scholar]
- 52.Muthukumar T, Dadhania D, Ding R, et al. Messenger RNA for FOXP3 in the urine of renal-allograft recipients. N Engl J Med. 2005;353(22):2342–2351. [DOI] [PubMed] [Google Scholar]
- 53.Zhang Y, Zhang Y, Gu W, Sun B. TH1/TH2 cell differentiation and molecular signals. Adv Exp Med Biol. 2014;841:15–44. [DOI] [PubMed] [Google Scholar]
- 54.Benichou G, Gonzalez B, Marino J, et al. Role of memory T cells in allograft rejection and tolerance. Front Immunol. 2017;8:170. [DOI] [PMC free article] [PubMed] [Google Scholar]
- 55.Beura LK, Rosato PC, Masopust D. Implications of resident memory T cells for transplantation. Am J Transplant. 2017;17(5):1167–1175. [DOI] [PMC free article] [PubMed] [Google Scholar]
- 56.de Leur K, Dieterich M, Hesselink DA, et al. Characterization of donor and recipient CD8+ tissue-resident memory T cells in transplant nephrectomies. Sci Rep. 2019;9(1):5984. [DOI] [PMC free article] [PubMed] [Google Scholar]
- 57.Fu J, Sykes M. Emerging concepts of tissue-resident memory T cells in transplantation. Transplantation. 2022;106(6):1132–1142. [DOI] [PMC free article] [PubMed] [Google Scholar]
- 58.Shi T, Burg AR, Caldwell JT, et al. Single-cell transcriptomic analysis of renal allograft rejection reveals insights into intragraft TCR clonality. J Clin Invest. 2023;133(14):e170191. [DOI] [PMC free article] [PubMed] [Google Scholar]
- 59.Niederlova V, Tsyklauri O, Chadimova T, et al. CD8(+) Tregs revisited: a heterogeneous population with different phenotypes and properties. Eur J Immunol. 2021;51(3):512–530. [DOI] [PubMed] [Google Scholar]
- 60.Angeletti A, Cantarelli C, Riella LV, et al. T-cell exhaustion in organ transplantation. Transplantation. 2022;106(3):489–499. [DOI] [PubMed] [Google Scholar]
- 61.Vallania F, Tam A, Lofgren S, et al. Leveraging heterogeneity across multiple datasets increases cell-mixture deconvolution accuracy and reduces biological and technical biases. Nat Commun. 2018;9(1):4735. [DOI] [PMC free article] [PubMed] [Google Scholar]
- 62.Aliee H, Theis FJ. AutoGeneS: Automatic gene selection using multi-objective optimization for RNA-seq deconvolution. Cell Syst. 2021;12(7):706–715 e704. [DOI] [PubMed] [Google Scholar]
- 63.Im Y, Kim Y. A comprehensive overview of RNA deconvolution methods and their application. Mol Cells. 2023;46(2):99–105. [DOI] [PMC free article] [PubMed] [Google Scholar]
- 64.Alonso-Moreda N, Berral-Gonzalez A, De La Rosa E, et al. Comparative analysis of cell mixtures deconvolution and gene signatures generated for blood, immune and cancer cells. Int J Mol Sci. 2023;24(13):10765. [DOI] [PMC free article] [PubMed] [Google Scholar]
- 65.Tan L, Nie M, Song L, et al. The role of circulating T follicular helper cells in kidney transplantation. Transpl Immunol. 2021;69:101459. [DOI] [PubMed] [Google Scholar]
Associated Data
This section collects any data citations, data availability statements, or supplementary materials included in this article.