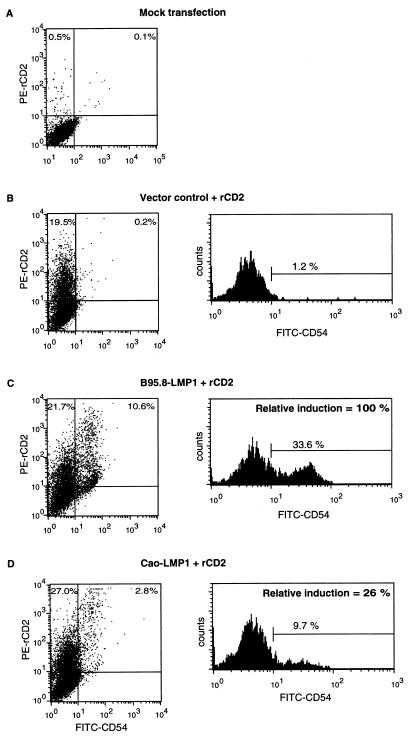
FIG. 2.
Flow cytometry assay for the induction of cell surface CD54 expression 40 h after transfection of Eli-BL cells with B95.8-LMP1 or CAO-LMP1 genes. (A to D) Two-color flow cytometry analysis of four transfections. The cells were stained for rCD2 with PE-conjugated antibody and for CD54 with FITC-conjugated antibody; the left-hand panels show the two-color plots of the total viable population, while the right-hand panels show histograms of CD54 staining of the subpopulation of cells gated for PE-rCD2 positivity. The four transfections were as follows: mock-transfected cells with no rCD2 or LMP1 DNA (A), control transfected cells with pSG5 vector plus rCD2 DNA (B), B95.8-LMP1 plus rCD2 DNA (C), and CAO-LMP1 plus rCD2 DNA (D). An arbitrary gate was set on the control transfection CD54 histogram (B) so that 1.2% of the transfected cells were classified as positive for CD54. The same gate was applied to the CD54 histograms of the B95.8-LMP1 (C) and CAO-LMP1 (D) transfections, which gave 33.6 and 9.7% CD54-positive cells, respectively. (E) Western blot illustrating the expression of LMP1 in the transfected Eli-BL cultures. The blot was probed with CS.1–4 anti-LMP1 MAbs, and the samples (left to right) were equivalent amounts of whole-cell protein from the reference X50-7 EBV-transformed LCLs, the vector control-transfected Eli-BL cells from panel B, the B95.8-LMP1-transfected Eli-BL cells from panel C, and the CAO-LMP1-transfected cells from panel D.


