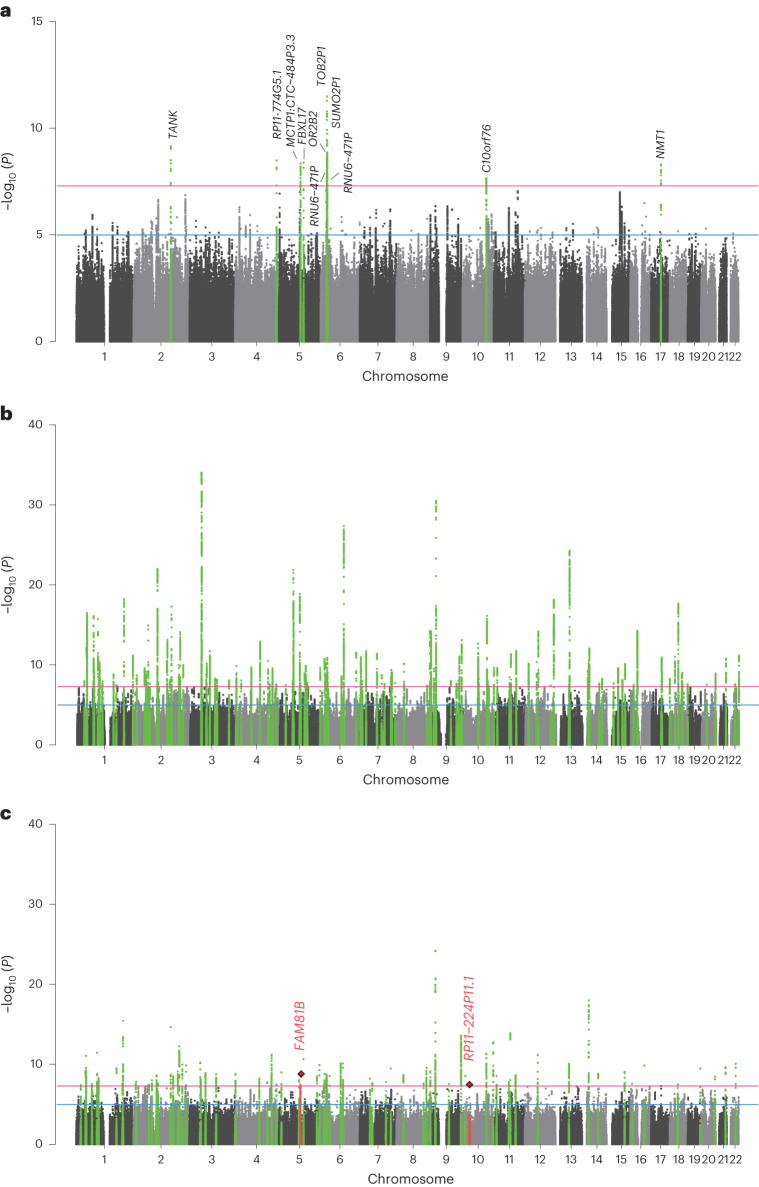
Fig. 1. Gene discovery through common variant associations for EduYears in EAS and EUR populations.
a, Manhattan plot of genome-wide meta-analysis for EduYears in EAS. b, Manhattan plot of cross-population genome-wide meta-analysis for EduYears in EAS and EUR. c, Manhattan plot of MAMA for EduYears in EAS. The x axis represents chromosomal position, and the y axis represents the −log10(P value) for the association of variants with EduYears. Reported P values are two-sided and not corrected for multiple testing. Independent SNPs are highlighted in green, and previously unreported SNPs are highlighted with a red diamond. The horizontal pink line marks the threshold for genome-wide significance (P = 5 × 10⁻⁸), and the horizontal blue line marks the threshold for suggestive genome-wide significance (P = 1 × 10⁻⁵).

