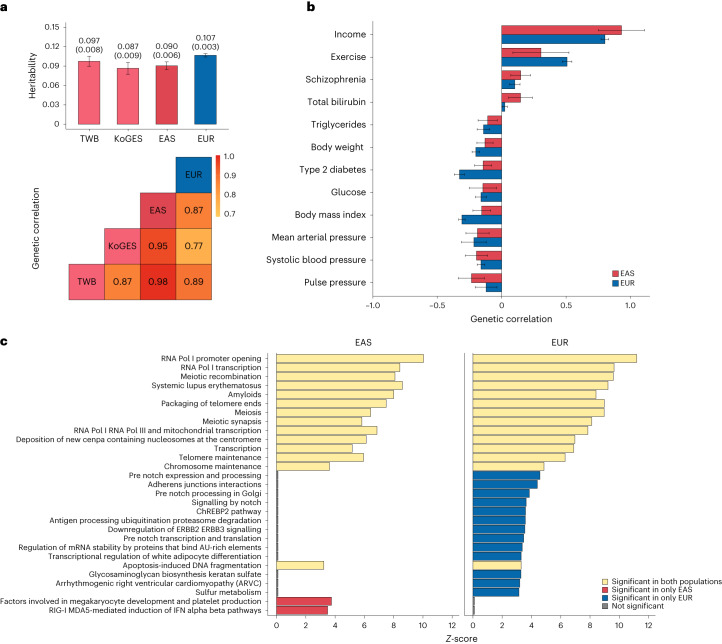
Fig. 2. Comparison of genetic architecture for EduYears between EAS and EUR.
a, SNP-based heritability and genetic correlation for EduYears in EAS and EUR. Top: we performed the LDSC to estimate the SNP-based heritability of EduYears in TWB (N = 93,570), KoGES (N = 71,662), EAS populations (N = 165,232) and EUR populations (N = 766,345). The x axis represents the population, and the y axis represents the SNP-based heritability. Bars indicate the estimates of SNP-based heritability for each population. Error bars (black line) indicate the 95% confidence intervals of the estimated SNP-based heritability. Bottom: we also performed the LDSC to estimate the genetic correlations between TWB, KoGES, EAS populations and EUR populations. The pairwise genetic correlations between TWB, KoGES, EAS populations and EUR populations are shown in red to yellow gradient. That is, colour close to red indicates a higher correlation, and colour close to yellow indicates a lower correlation. b, SNP-based genetic correlation between EduYears and other phenotypes in EAS and EUR. We showed 12 of 82 phenotypes with significant genetic correlation with EduYears (FDR <5%) in the EAS population. The x axis is the genetic correlation between EduYears and other traits. Bars indicate the estimates of genetic correlation between EduYears and each trait. Error bars (black line) indicate the 95% confidence intervals of the estimated genetic correlation. All results including the sample size of each trait are presented in Supplementary Table 18. c, Pathway enrichment for EduYears in EAS and EUR. We showed significantly enriched pathways with a q value <0.05 for EAS and EUR populations. The x axis represents the Z-score, and the y axis represents each individual pathway.

