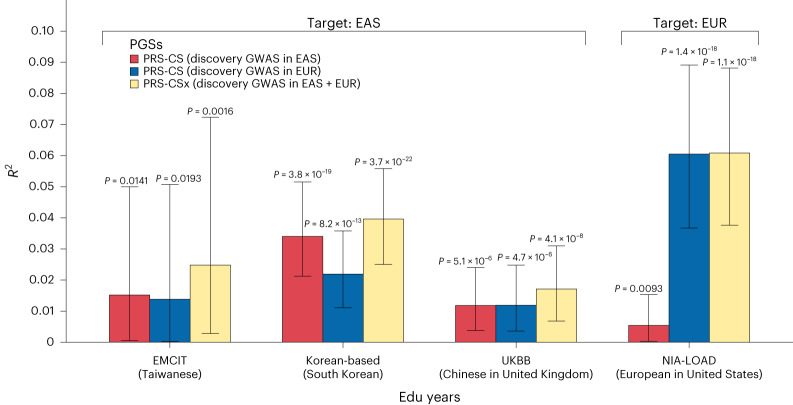
Fig. 4. Polygenic prediction of EduYears in the EMCIT (n = 395; EAS), Korean-based cohort (n = 2,622; EAS), Chinese samples in the UKBB (n = 1,747; EAS), and the NIA-LOAD (n = 1,241; EUR).
The x axis shows the testing cohort, and the y axis is the partial R2 for the PGS. Bars indicate the partial R2 for the PGS of each cohort. Error bars (black line) indicate the 95% confidence intervals of the partial R2 for PGS. PGSs were derived from the GWAS meta-analysis for EduYears in EAS by using PRS-CS (discovery GWAS in EAS), the GWAS meta-analysis for EduYears in EUR by using PRS-CS (discovery GWAS in EUR), and both GWAS meta-analysis for EduYears, including EAS and EUR, by using PRS-CSx (discovery GWAS in EAS and discovery GWAS in EUR). We adjusted for the birth year, sex, birth year by sex interaction, and top ten PCs in all models. The two-sided P value of the partial R2 was derived from a likelihood ratio test comparing the goodness of fit of the models with and without PGS, which were annotated above the error bars.

