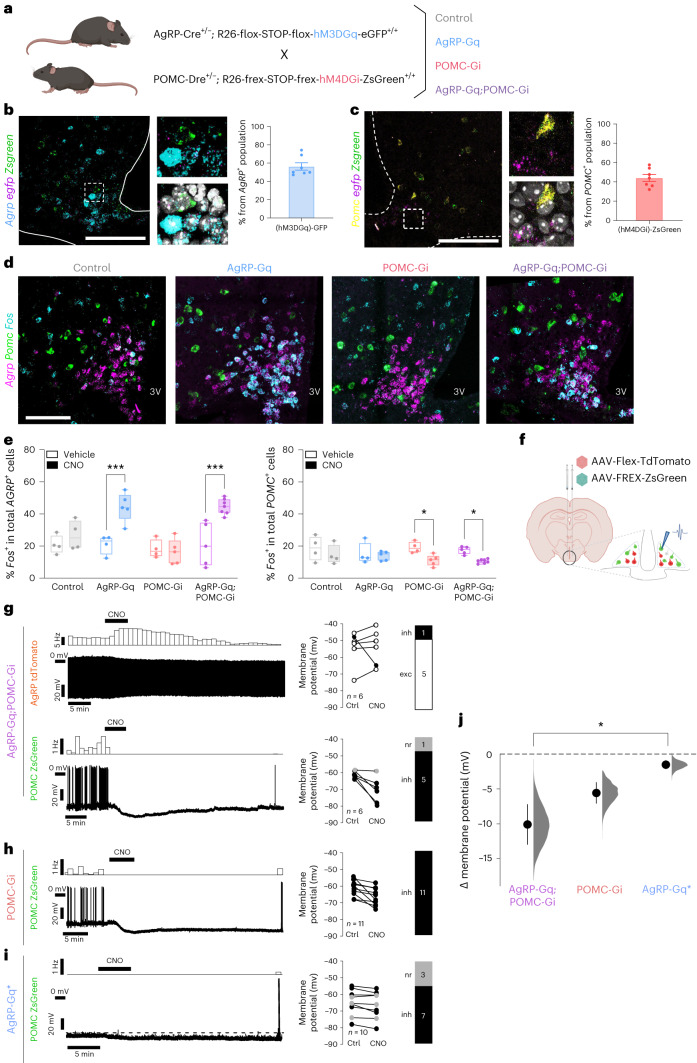
Fig. 1. Cre and Dre recombinases drive specific expression of opposite chemogenetic receptors in AgRP and POMC neurons.
a, Breeding strategy and experimental groups. b, Representative images and quantification of Cre-mediated hM3DGq-eGFP expression in AgRP neurons (n = 7 mice) c, Representative image and quantification of Dre-mediated hM4DGi-ZsGreen expression in POMC neurons (n = 7 mice). d, Representative images showing Fos (cyan) colocalization with AgRP+ (magenta) and POMC+ (green) neurons in experimental groups treated with CNO for 1 h. e, Quantification of percentage of AgRP+ and POMC+ neurons colocalized with Fos mRNA 1 h after vehicle or CNO injection. AgRP+ neurons: ***P = 0.0007 AgRP-Gq, ***P = 0.0001 AgRP-Gq;POMC-Gi, vehicle versus CNO; POMC+ neurons: *P = 0.0375 POMC-Gi, *P = 0.473 AgRP-Gq;POMC-Gi, vehicle versus CNO. Data are presented as the mean ± s.e.m. of the percentage of AgRP or POMC neurons in one ARC hemisection (n = 4 and 4 control mice; 4 and 5 AgRP-Gq mice; 4 and 5 POMC-Gi mice; 5 and 7 AgRP-Gq;POMC-Gi mice, vehicle versus CNO, respectively, for each group). Statistical significance was determined by two-way analysis of variance (ANOVA) followed by Bonferroni’s test. Box plots indicate the median ± minimum/maximum values and include data points of individual mice. Scale bar, 100 µm. f, Scheme of experimental design. g–i, Perforated patch-clamp recordings and rate-histograms displaying the effects of 3 µM CNO on POMC-ZsGreen+ and AgRP-tdTomato+ neurons. Bar graphs represent the proportion of neurons classified as CNO responders at the individual-cell level (Methods): excited (exc, white), not responsive (nr, grey) and inhibited (inh, black). All recordings were performed in the presence of glutamate and GABA receptor blockers, except i. g, Recordings from AgRP-tdTomato+ neurons (upper) and from POMC-ZsGreen+ neurons (lower) from AgRP-Gq:POMC-Gi mice (n = 6 cells). h, Recordings from POMC-ZsGreen+ neurons from POMC-Gi mice (n = 11 cells). i, Recording from POMC-ZsGreen+ neurons from AgRP-Gq* mice (n = 10 cells) in the absence of synaptic blockers. The dashed line serves to emphasize the effect. j, Summarized effects of 3 µM CNO-mediated DREADD activation in POMC neurons. Data are displayed as the mean ± s.e.m. of changes in membrane potential calculated from all recordings shown in g–i. All population responses measured in the respective experimental groups were statistically significant AgRP-Gq:POMC-Gi (−10.1 ± 2.9 mV, n = 6, P = 0.03, Wilcoxon matched-pairs signed-rank test), POMC-Gi (−5.6 ± 1.5 mV, n = 11, P = 0.004, two-tailed paired t-test) and AgRP-Gq (−1.6 ± 0.6 mV, n = 10, P = 0.03, two-tailed paired t-test). Comparison of the effect sizes between groups showed a significant difference in POMC neuron hyperpolarization between AgRP-Gq:POMC-Gi and AgRP-Gq* mice (P = 0.01; Kruskal–Wallis test with Dunn’s multiple-comparison test). Based on the observed data, the filled grey curves indicate the resampled distribution (5,000 bootstrap samples). Figure 1a,f created with BioRender.com.

