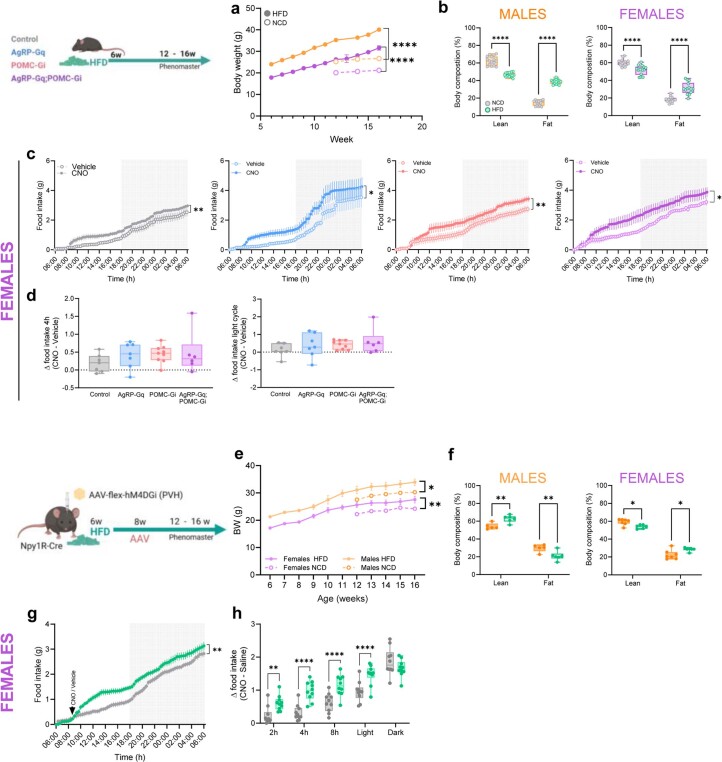
Extended Data Fig. 9. Female and extended data for impact of HFD-induced obesity on food intake modulated by reciprocal interplay between AgRP and POMC neurons.
a, Body weight curves during HFD exposition in males and females, and comparison with normal body weight curves in normal chow diet (NCD) fed mice. ****P < 0.0001. Mice from the four experimental groups were pooled together. (n = 8 mice/group, diet and sex, 2 mice per each experimental group). b, Body composition changes in 16weeks old male and female mice fed with NCD or HFD. Mice from the four experimental groups were pooled in balanced ratios (n = 16 male and 14 female mice/diet). c, Cumulative food intake curves from HFD-fed female mice treated with vehicle or CNO at the beginning of the light phase. Vehicle vs. CNO: **P = 0.0094 control, *P = 0.0278 AgRP-Gq, **P = 0.0061 POMC-Gi, *P = 0.0278 AgRP-Gq;POMC-Gi. (n = 7 control, 7 AgRP-Gq, 9 POMC-Gi, 6 AgRP-Gq;POMC-Gi female mice) d, Delta food intake (Δ = CNO – vehicle) for the 0–4h interval and the light cycle interval in HFD-fed female mice. (n = 7 control, 7 AgRP-Gq, 9 POMC-Gi, 6 AgRP-Gq;POMC-Gi female mice). e, Body weight curves during HFD exposition in male and female Npy1R-Gi mice, and comparison with normal body weight curves in NCD fed mice. *P = 0.0384 male mice, and **P = 0.0089 female mice (n = 6 mice/sex and diet). f, Body composition changes in 16 weeks old male and female Npy1R-Gi mice treated with NCD or HFD. Males: **P = 0.0085 lean mass, and P = 0.0069 fat mas. Females: *P = 0.0285 lean and *P = 0.013 fat mass. (n = 5 NCD- and 6 HFD-fed male mice, 7 NCD- and 6 HFD-fed female mice) g, Cumulative food intake curves from HFD-fed Npy1R-GiPVH female mice and treated with vehicle (grey lines) or CNO (green curves) at the beginning of the light cycle ** P = 0.093. (n = 10 female mice). h, Food intake at time intervals in HFD-fed Npy1R-GiPVH female mice. **P = 0.0012 at 2h, and ****P < 0.0001 at 4h, 8h and light cycle interval. Data represents mean ± s.e.m for each experimental group mice. Boxplots indicate median ±min/max and include data points of individual mice entering the analysis Statistical test: ordinary one-way ANOVA in d; 2-way ANOVA Mixed-effects model in a, e; 2-way ANOVA followed by Tukey′s multiple comparisons test in b; and Bonferroni’s test in c, g, and Sidak’s test in f and h. Source data and further details of statistical analyses are provided as a Source Data file. Created with BioRender.com.

