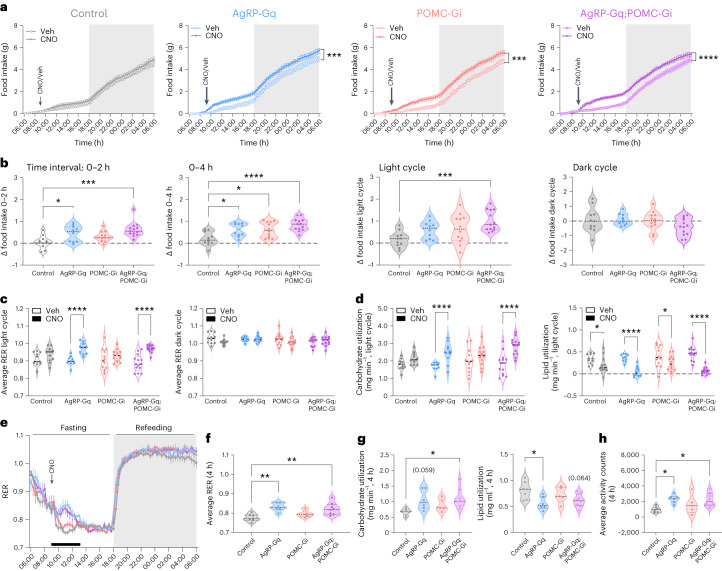
Fig. 2. Coordinated effect in the regulation of food intake from the interaction of AgRP and POMC neurocircuits.
a, Cumulative food intake in male mice treated with vehicle and CNO in crossover experimental design. Dark cycle is indicated by the grey rectangle. ***P < 0.004 AgRP-Gq and ***P = 0.009 POMC-Gi, ****P < 0.0001 AgRP-Gq;POMC-Gi, vehicle versus CNO. b, Quantification of delta food intake (∆ = CNO − vehicle) during the indicated time intervals. Control versus AgRP-Gq: *P = 0.0292 (2 h) and *P = 0.0193 (4 h); control versus POMC-Gi: *P = 0.012 (4 h); control versus AgRP-Gq;POMC-Gi: ***P = 0.0003 (2 h), ****P < 0.0001 (4 h) and ***P = 0.0009 (light cycle) c, Average RER during light and dark cycles in male mice treated with vehicle or CNO. ****P < 0.0001, vehicle versus CNO. d, Quantification of carbohydrate and lipid utilization during light-cycle period by male mice treated with CNO and vehicle, calculated as: *P = 0.0359 for control, *P = 0.0121 for POMC-Gi, ****P < 0.001 for AgRP-Gq and AgRP-Gq;POMC-Gi groups, vehicle versus CNO. e, RER curves in male mice treated with CNO without access to food during the light cycle, following by refeeding at the beginning of the dark cycle. Black bar indicates the 4-h period after CNO injection. f, Average RER during the 4-h period. **P = 0.0021 and **P = 0.0067 for control versus AgRP-Gq and AgRP-Gq;POMC-Gi, respectively. g, Quantification of carbohydrate and lipid usage during the 4-h fasting period. Carbohydrates: *P = 0.0137 control versus AgRP-Gq;POMC-Gi; lipids: *P = 0.0222 control versus AgRP-Gq. h, Total activity counts during the 4-h period. *P = 0.026 and *P = 0.0259 for control versus AgRP-Gq and AgRP-Gq;POMC-Gi, respectively. Data represent the mean ± s.e.m. of the biological replicates for each group: a–d: n = 11 control, 10 AgRP-Gq, 12 POMC-Gi and 13 AgRP-Gq;POMC-Gi male mice; e–j: n = 7 control, 6 AgRP-Gq, 5 POMC-Gi and 8 AgRP-Gq;POMC-Gi male mice. Statistical significance was determined by two-way ANOVA followed by Bonferroni test for a and c–e; and one-way ANOVA followed by Tukey’s multiple-comparison test for b and f–h. Data from female mice are displayed in Extended Data Fig. 3.

