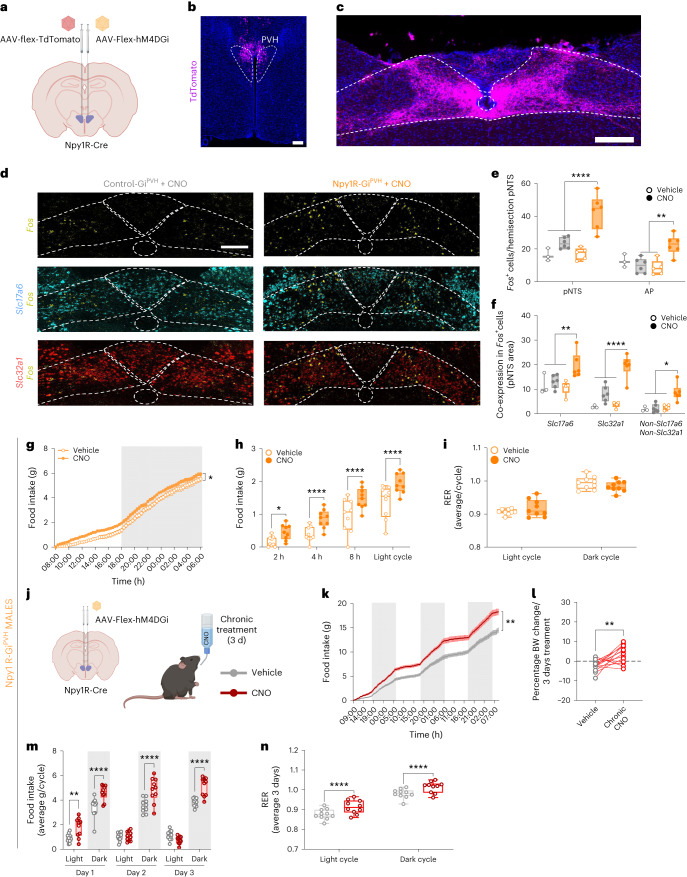
Fig. 4. Inhibition of Npy1RPVH neurons activates glutamatergic and GABAergic neurons at the NTS area and promotes food intake in male mice.
a, Schematic of AAV delivery into the PVH area of Npy1R-Cre+/− mice. b, Representative image of AAV-Flex-tdTomato injection site into the PVH area (n = 3 independent replicates). c, Image of posterior NTS/AP area showing axonal projections from Npy1RPVH-tdTomato+ neurons (n = 2 independent replicates). d, Representative FISH images of pNTS area showing the colocalization of Fos (yellow) and Slc17a6 (cyan) or Slc32a1 (red) markers in control-GiPVH and Npy1R-GiPVH mice treated with CNO for 1 h in the absence of food. e, Quantification of total Fos+ cells in the pNTS and AP areas in control-GiPVH (grey bars, n = 3 vehicle-treated and 6 CNO-treated mice) and Npy1R-GiPVH mice (orange bars, n = 5 vehicle-treated and 6 CNO-treated mice) after vehicle (open bars) or CNO injection (solid bars). **P = 0.022 and ****P < 0.001. f, Quantification of the total Fos+ cells that co-expressed Slc17a6 and Slc32a1 markers in pNTS area after vehicle or CNO injection. (n = 3 vehicle-treated and 6 CNO-treated control-GiPVH mice; and n = 5 vehicle-treated and 6 CNO-treated Npy1R-GiPVH mice). *P = 0.0164, **P = 0.0052 and ****P < 0.001. g, Cumulative food intake during 24 h in ad libitum-fed Npy1R-GiPVH mice treated with vehicle (open dots) and CNO (solid dots; n = 9 male mice), *P = 0.0253. h, Quantification of delta food intake (∆ = CNO − vehicle) at different intervals after vehicle or CNO injection in Npy1R-GiPVH mice (n = 9 male mice), *P = 0.013 and ****P < 0.001. i, Average of RER in light and dark cycles from Npy1R-GiPVH mice treated with vehicle or CNO (n = 9 male mice). j, Scheme of chronic CNO treatments in Npy1R-GiPVH mice. k, Cumulative food intake along 3 d in mice treated chronically with CNO or vehicle in drinking water (n = 10 male mice) **P = 0.0026. l, Percentage of body weight gain after 3 d chronic treatment with vehicle or CNO (n = 15 male mice), **P = 0.0016. m, Average of food intake during light and dark cycles along the 3-d chronic treatment with vehicle or CNO in drinking water (n = 10 male mice), **P = 0.0051, ****P < 0.001. n, Average respiratory coefficient (RER) from 3 d of chronic treatment during light and dark cycles (n = 10 male mice), ****P < 0.0001. Data are presented as the average ± s.e.m. for each biological replicate. Box plots indicate the median ± minimum/maximum and include data points of individual mice. Statistical significance was determined by a two-tailed paired t-test for l; two-way ANOVA followed by Tukey’s test for e, f and n; and Bonferroni’s test for g–m. Scale bar, 100 µm. Figure 4a,j created with BioRender.com. Data from female mice are displayed in Extended Data Fig. 6.

