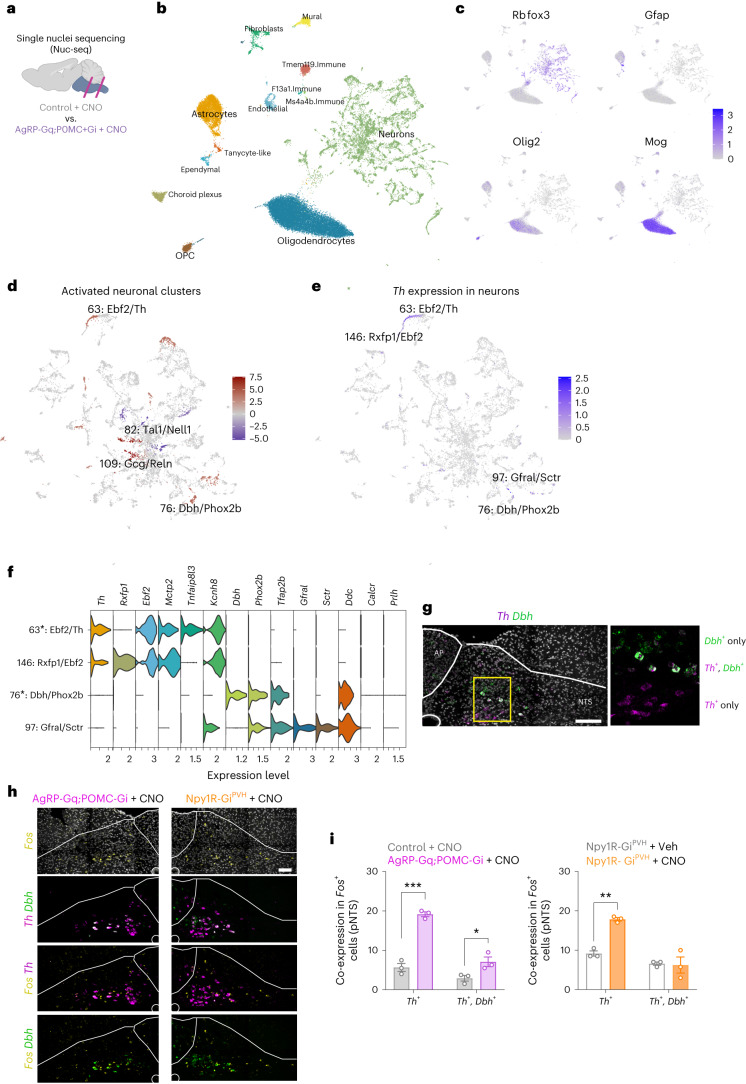
Fig. 5. Th+ neurons are activated in the posterior NTS area by the interplay of AgRP and POMC neurocircuits.
a, Schematic of the single-nucleus sequencing experiment from hindbrain samples. b, UMAP visualization of cell-type composition of hindbrain single-nucleus sequencing data (n = 2 control and 2 AgRP-Gq;POMC-Gi mice). c, UMAP showing the distribution of main cell-type markers. Colour corresponds to log-normalized expression d, UMAP highlighting the top activated (red) or inhibited (blue) neuronal clusters. Colour displays a score based on differential gene expression between AgRP-Gq:POMC-Gi and control mice of ten core IEGs (Methods). e, UMAP showing the expression of the Th gene in neuronal clusters. f, Violin plot of expression level of main marker genes associated with the selected Th+ and Dbh+ clusters. The asterisk denotes clusters with higher-ranking IEGs. g, Representative image showing the spatial distribution of neurons that express Th+, Dbh+ and Th+Dbh+ by mRNA FISH in the posterior NTS area (n = 3 mice per group). h, Representative images showing the distribution and colocalization of Fos+ (yellow) neurons that express Th+ (magenta) and Dbh+ (green) from AgRP-Gq;POMC-Gi and Npy1R-GiPVH mice treated with CNO for 1 h. i, Quantification of Fos+ colocalization with total Th+ and Th+Dbh+ neurons in posterior NTS from AgRP-Gq;POMC-Gi and Npy1R-GiPVH mice relative to their respective control (n = 3 mice per group), *P = 0.0448, **P = 0.0011 and ***P = 0.0004. Data represent the mean ± s.e.m. for each group and treatment. Statistical significance was determined by two-way ANOVA followed by Bonferroni’s multiple-comparison test. Scale bar, 100 µm. Figure 5a created with BioRender.com.

