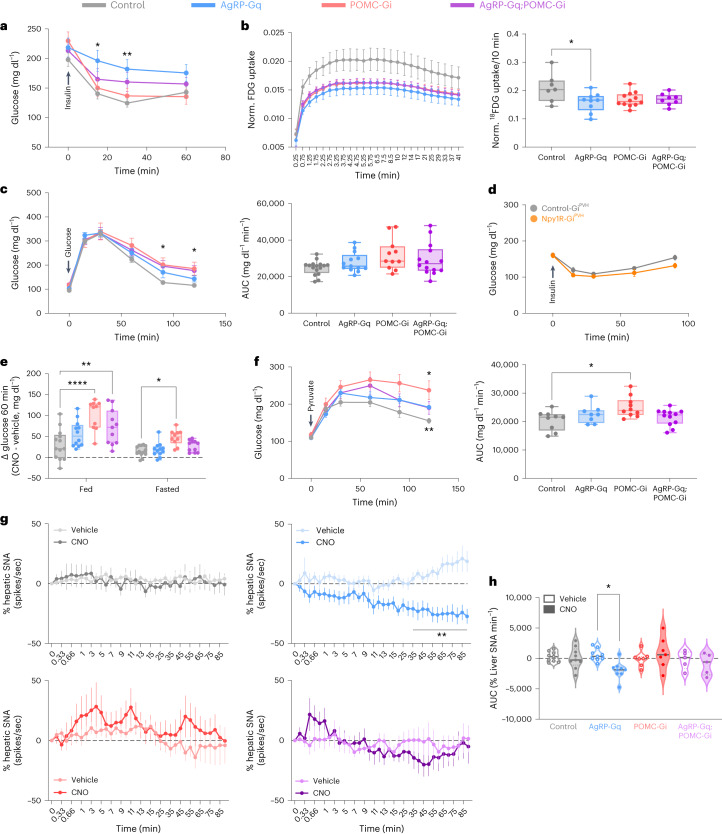
Fig. 6. Insulin sensitivity and liver SNA are controlled by the antagonistic interplay between the AgRP and POMC neurocircuits in male mice.
a, Insulin tolerance test performed in ad libitum-fed male mice treated with CNO for 1 h before insulin injections. *P = 0.0125 at 15 min and **P = 0.0094 at 30 min in AgRP-Gq versus control mice. b, Curves of 18FDG uptake in BAT tissue (right) from male mice treated with CNO for 1 h and AUC quantification of 18FDG uptake (left) during 10 min in BAT tissue from male mice. *P = 0.0234 AgRP-Gq versus control. c, Glucose tolerance test and quantification of AUC in 16-h-fasted male mice treated with CNO for 1 h before glucose injection. *P = 0.0309 at 90 min and **P = 0.0487 at 120 min in POMC-Gi versus control. d, Insulin tolerance test performed in ad libitum-fed male control-GiPVH (grey lines) and Npy1R-GiPVH (orange lines) male mice. e, Changes in glucose levels during 1 h after CNO injection in ad libitum-fed and 16-h fasted mice, *P = 0.0377 POMC-Gi versus control in fasting, **P = 0.0028 AgRP-Gq;POMC-Gi versus control and ****P < 0.0001 POMC-Gi versus control. f, Glucose levels and quantification of AUC during a pyruvate tolerance test performed in 16-h-fasted male mice after 1 h CNO injection. *P = 0.0418 POMC-Gi versus control, **P = 0.0021 AgRP-Gq versus control, and *P = 0.0199 POMC-Gi versus control in AUC. g, Changes in hepatic SNA after intravenous (i.v.) administration of vehicle or CNO (1 mg per kg body weight) in anaesthetized mice. Data are presented as the mean with 95% confidence interval. h, Quantification of the AUC of changes in liver SNA. *P = 0.0273 vehicle versus CNO in AgRP-Gq group. Data are presented as the average ± s.e.m. for each mouse, except on g. Box plots indicate the median ± minimum/maximum and include data points of individual mice. Biological replicates are: a, n = 20 control, 12 AgRP-Gq, 15 POMC-Gi and 13 AgRP-Gq;POMC-Gi male mice; b, n = 7 control, 9 AgRP-Gq, 12 POMC-Gi and 8 AgRP-Gq;POMC-Gi male mice; c, n = 16 control, 13 AgRP-Gq, 11 POMC-Gi and 14 AgRP-Gq;POMC-Gi male mice; d, n = 5 control-Gi and 9 Npy1R-Gi male mice; e, n = 13 control, 12 AgRP-Gq, 10 POMC-Gi and 11 AgRP-Gq;POMC-Gi male mice; f, n = 9 control, 8 AgRP-Gq, 10 POMC-Gi and 12 AgRP-Gq;POMC-Gi male mice; g and h: n = 9 control, 9 AgRP-Gq, 7 POMC-Gi and 5 AgRP-Gq;POMC-Gi mice. Statistical significance was determined by one-way ANOVA followed by Tukey’s multiple-comparison test for b, c and h; two-way ANOVA followed by Tukey’s multiple-comparison test for a, e and f, and by Bonferroni’s multiple-comparison test for c, d and g. Data from female mice are displayed in Extended Data Fig. 8.

