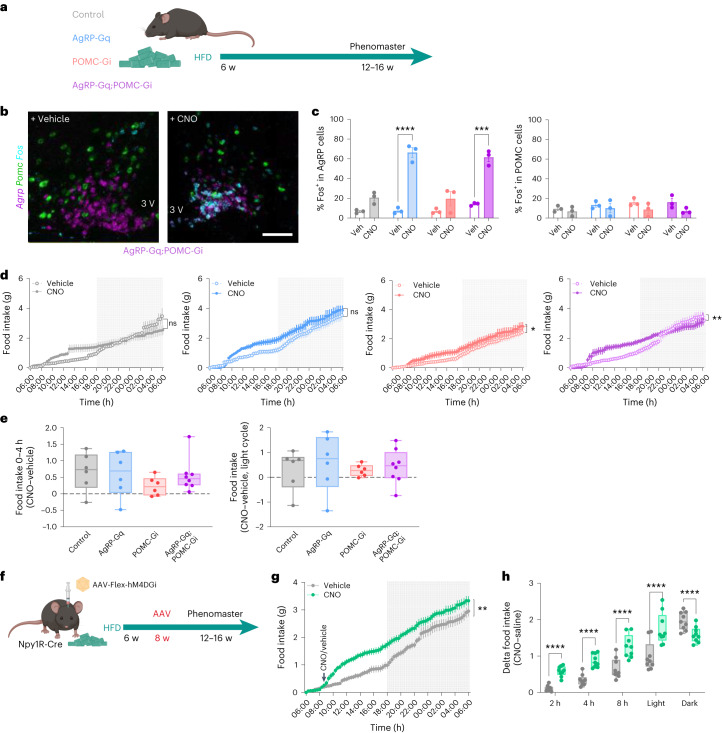
Fig. 7. Obesity disrupts the coordinated regulation from AgRP and POMC neurocircuits over food intake and insulin sensitivity in male mice.
a, Scheme for HFD-induced obesity. b, Representative images of the ARC area from AgRP-Gq;POMC-Gi HFD-fed mice treated with vehicle or CNO showing the colocalization of Fos mRNA (cyan) with Agrp (magenta) and Pomc (green) neurons. c, Percentage of Fos colocalization on total AgRP (left) and POMC (right) neurons ***P = 0.0001 AgRP-Gq;POMC-Gi vehicle versus CNO; and ****P < 0.0001 AgRP-Gq vehicle versus CNO data represent the average ± s.e.m. of cell counts per hemisection from n = 3 mice for each group and treatment. d, Cumulative food intake curves from HFD-fed male mice treated with vehicle or CNO at the beginning of the light phase *P = 0.0362 for POMC-Gi, vehicle versus CNO, and **P = 0.0095 AgRP-Gq;POMC-Gi, vehicle versus CNO. e, Delta food intake (Δ = CNO – vehicle) for the 0–4-h interval and during the light cycle from HFD-fed male mice. f, Schematic of experimental design in Npy1R-GiPVH mice. g, Cumulative food intake curves from HFD-fed male Npy1R-GiPVH mice treated with vehicle or CNO, **P = 0.0024 vehicle versus CNO. h, Food intake at time intervals in HFD-fed Npy1R-Gi male mice, ****P < 0.0001 vehicle versus CNO. Data are represented as the average ± s.e.m. per mouse and treatment from the following biological replicates: d and e, n = 6 control, 6 AgRP-Gq, 6 POMC-Gi and 8 AgRP-Gq;POMC-Gi HFD-fed male mice; g and h, n = 9 HFD-fed Npy1R-Gi male mice. Box plots indicate the median ± minimum/maximum and include data points of individual mice. Statistical significance was determined by one-way ANOVA followed by Tukey’s test for e, two-way ANOVA followed by Sidak’s multiple-comparison test for c, d and h and Bonferroni’s test for g. Scale bar, 100 µm. Figure 7a,f created with BioRender.com. Data from female mice are displayed in Extended Data Fig. 9c,d.

