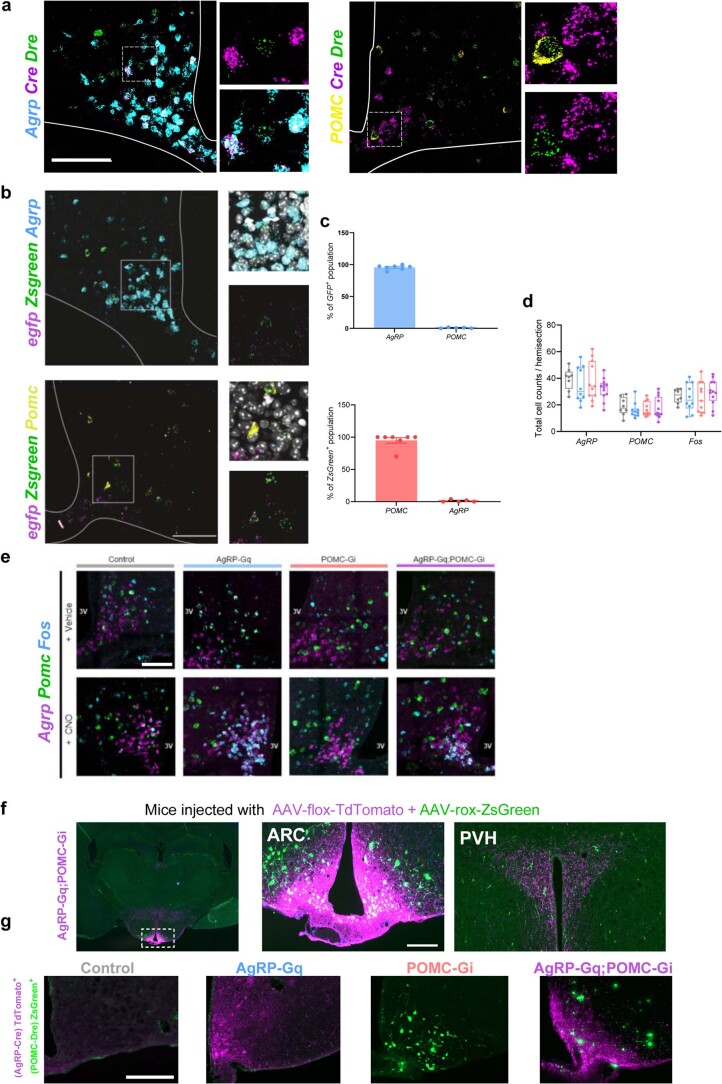
Extended Data Fig. 1. Selective expression of Cre- and Dre- recombinases in AgRP and POMC neurons.
a, Representative images of exclusive localization of Cre recombinase (magenta) on AgRP+ neurons (cyan) and Dre recombinase (green) on POMC+ neurons (yellow) (n = 4 mice). b, Representative images showing the expression of egfp (magenta) and Zsgreen (green) mRNA, attached markers of DREADDs hM3DGq and hM4DGi, respectively, together with Fos mRNA (cyan) in sections from CNO-treated AgRP-Gq;POMC-Gi mice (n = 7 mice/group). c, Quantification of the percentage of AgRP and POMC neurons that co-express egfp or Zsgreen markers, (n = 3 AgRP-Gq and 4 AgRP-Gq;POMC-Gi mice for upper panel, 3 POMC-Gi and 4 AgRP-Gq;POMC-Gi mice for lower panel). d, Quantification of total cell counts expressing Agrp, P or Fos mRNA from experimental groups in basal conditions. Boxplots indicate median ±min/max and include data points of individual mice. (n = 8 control, 10 AgRP-Gq, 11 POMC-Gi and 12 AgRP-Gq;POMC-Gi mice). e, Representative images from coronal ARC sections showing the colocalization of Agrp (magenta) and POMC (green) neurons with Fos (cyan) after experimental mice were injected with vehicle or CNO. f, Representative images showing the distribution AgRP-Tomato+ and POMC-ZsGreen+ axonal projections in the hypothalamus, ARC and PVH areas from AgRP-Gq;POMC-Gi mice bilaterally injected with AAV-flox-tdTomato + AAV-rox-Zsgreen. g, Representative images showing the selective recombination and expression of fluorescent proteins by AgRP and POMC neurons. Mice from all experimental groups were injected bilaterally with a mix of AAV-flox-tdTomato + AAV-frex-ZsGreen (n = 2 AgRP-Gq;POMC-Gi mice). Data represent the mean ± s.e.m for each group and treatment. Source data and further details of statistical analyses are provided as a Source Data file. Scale bar = 100 µm.

