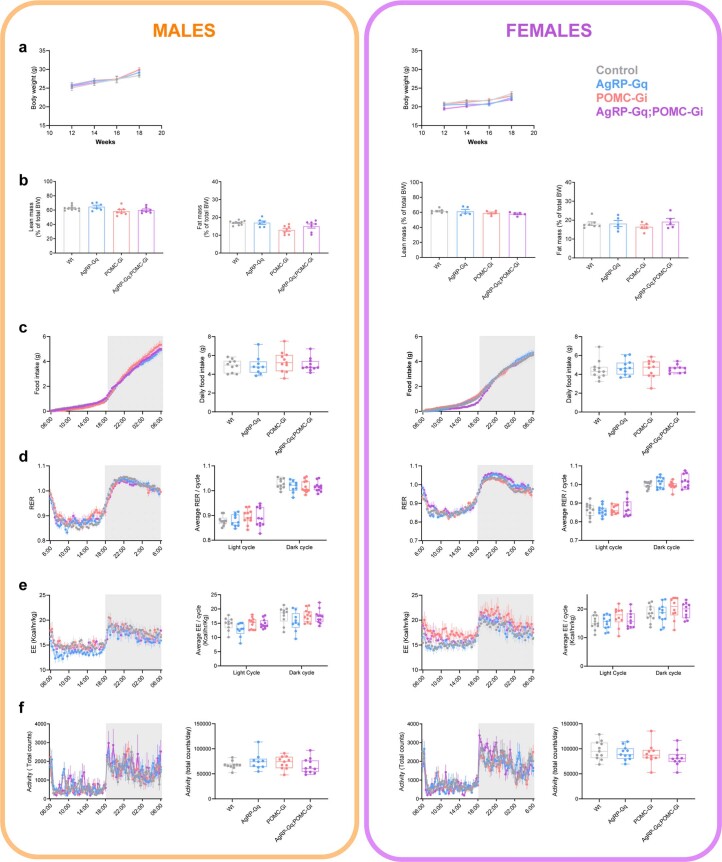
Extended Data Fig. 2. Metabolic phenotyping of experimental mouse lines in basal conditions.
Data from males (left) and females (right) from the four experimental groups showing: a, Body weight curves between 12 and 18 weeks of age. b, Body weight composition. c, Daily basal food intake, in cumulative curve and daily average. d, Respiratory coefficient (RER) curves and averages for light and dark cycles. e, Energy expenditure (EE) curves and averages for the light and dark cycles f, Total activity counts across 24h and average of daily activity. Data is presented as mean ± s.e.m from the biological replicates in each group (control, AgRP-Gq, POMC-Gi and AgRP-Gq;POMC-Gi, respectively) in a (n = 18, 16, 19, 20 male mice and 16, 20, 20, 18 female mice), b (n = 10, 6, 7, 7 male mice and 7, 5, 5, 5 female mice), c–f (n = 10, 9, 11, 11 male mice and 11, 11, 10, 10 female mice). Boxplots indicate median ± min/max and include data points of individual mice entering the analysis. Statistical test: Mixed-effects model in a and d-, e-left panels, one-way ANOVA in b and c-, f-right panel, and two-way ANOVA in c-, f-left panels and, d,-,e-right panel. Source data and further details of statistical analyses are provided as a Source Data file.

