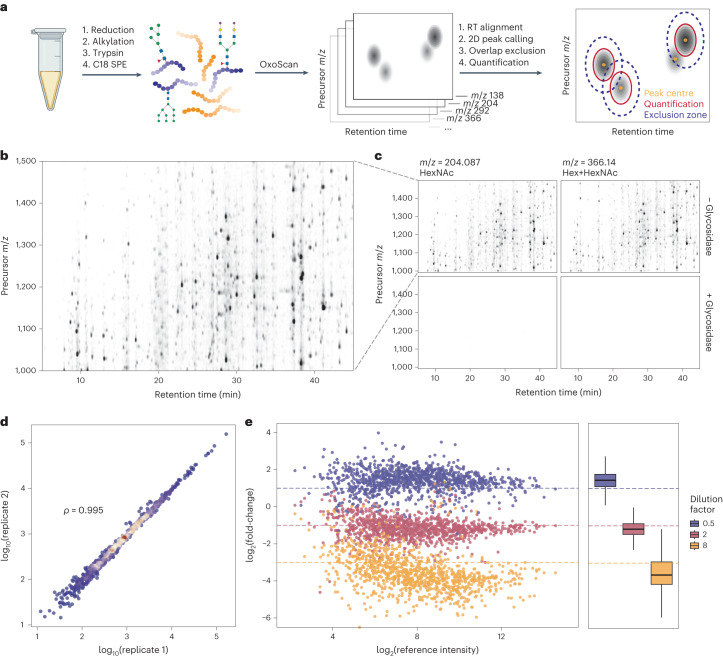
Fig. 2. Oxonium ion maps generate a specific and quantitative glycoproteome from the analysis of neat human plasma.
a, Oxonium ion profiling workflow, starting with the generation of oxonium ion maps from unenriched tryptic digests of serum/plasma (glyco)proteins and computational analysis. b, An oxonium ion map of human plasma tryptic digest, extracted for the m/z = 204.09 (HexNAc) oxonium ion. Each spot represents a glycopeptide in a specific charge state. c, Oxonium ion maps for two common oxonium ions present in tryptic digests of human plasma, with and without treatment with a mix of glycosidase enzymes (bottom and top panels, respectively). Peak intensity is proportional to opacity, and all panels are scaled to the maximum peak intensity across the experiment. d, Comparison of intensities between two injections of human plasma tryptic digests. Spearman correlation coefficient was calculated on the basis of glycopeptide feature intensities (n = 1,006). e, log2(fold-change) plotted for serum glycopeptide features from spiking in 3 different concentrations into an E. coli tryptic digest (n = 819). Fold-changes were calculated to a reference dilution factor of 1 and theoretical log2(fold-change) values expected for each dilution factor are plotted as dashed lines. The box-and-whisker plots display 25th, 50th (median) and 75th percentiles in boxes; whiskers display upper/lower limits of data (excluding outliers, not plotted). Figure 2a created with BioRender.com.

