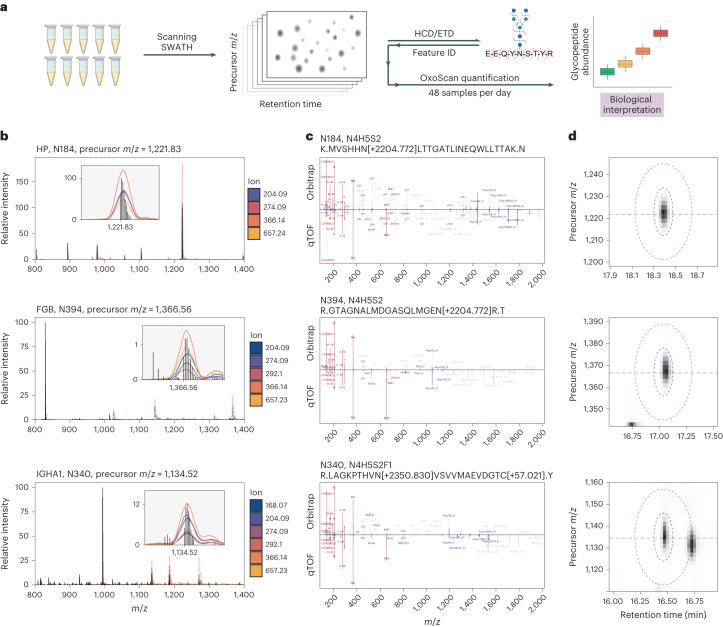
Fig. 4. Precursor assignment from the MS1 scanning dimension and subsequent MS/MS matching allow identification of candidate biomarker glycopeptides.
a, Plasma samples are measured using OxoScan-MS to generate oxonium ion maps, and glycopeptide features are identified with complementary fragmentation and database searching. OxoScan-MS then allows quantification of identified features across cohorts with >100s of samples. b, MS1 spectrum of tryptic plasma digest with Q1 profiles of oxonium ions overlaid. Oxonium ion traces localize glycopeptide precursor ions even in the presence of co-eluting unmodified peptides of significantly higher abundance. Inset shows zoomed-in oxonium ion traces with precursor m/z labelled on the x axis. Q1 profiles were acquired with a 2 m/z scanning window. Top: haptoglobin N-glycopeptide (Asn184). Middle: fibrinogen beta chain N-glycopeptide (Asn394). Bottom: immunoglobulin A N-glycopeptide (Asn340). c, Comparison of DDA (HCD) and DIA (CID) MS/MS spectra for respective glycopeptide precursors. Fragment assignments are taken from analysis of DDA data in Byonic (with a tolerance of 5 ppm for DDA and 20 ppm for DIA). Fragments observed in both DDA and DIA spectra (also matched to within 20 ppm) are shown in blue and oxonium ions are shown in red. All non-matched assignments are shown in grey. Respective panels show the same glycopeptides as in b. d, Oxonium ion elution profiles in both precursor m/z and RT space for respective glycopeptide precursors. Blue and red ellipses represent the quantification and exclusion regions, respectively, and the horizontal line indicates accurate (TOF) precursor m/z. Panels show the same glycopeptides as in b and c. Figure 4a created with BioRender.com.

