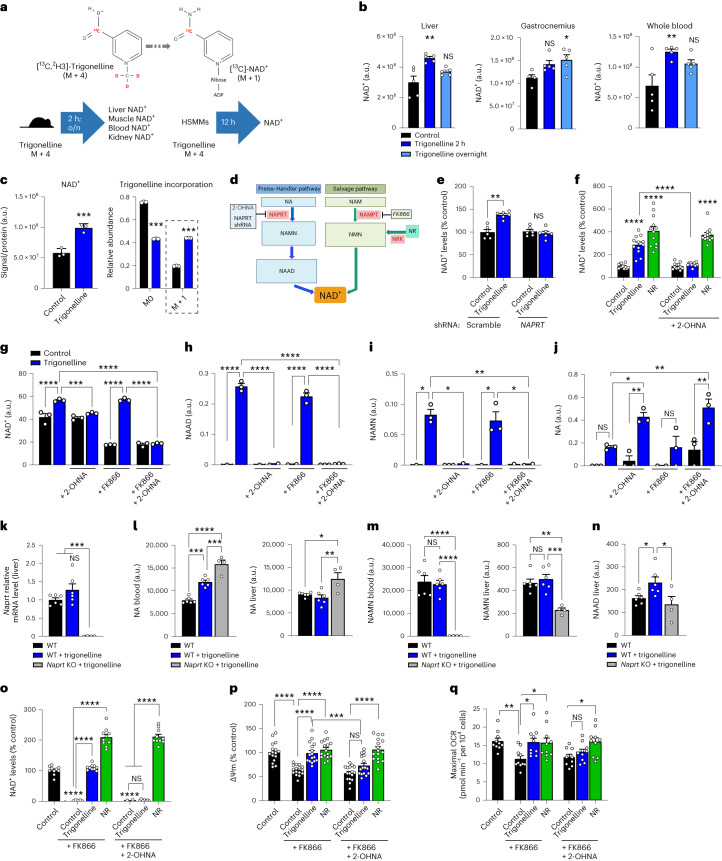
Fig. 2. Trigonelline is an NAD+ precursor and activates mitochondrial function via the Preiss–Handler pathway.
a, Experimental design of isotope-labelled trigonelline incorporation into NAD+. b, NAD+ levels measured using LC–HRMS in the liver, gastrocnemius muscle and whole blood 2 h or 16 h (overnight) after labelled trigonelline gavage in young mice (one-way ANOVA, n = 4–5 mice per group). c, NAD+ levels measured using LC–HRMS in HSMM (left) and relative isotopic enrichment of NAD+ (right) after 24-h incubation with 1 mM labelled trigonelline (unpaired, two-tailed Student’s t-test, n = 3 biological replicates per group). d, Representation of the Preiss–Handler and salvage pathways of NAD+ production. e, Relative NAD+ levels in HSMMs 48 h after adenoviral infection with a scrambled or NAPRT shRNA (unpaired, two-tailed Student’s t-test, n = 6 biological replicates per group). f, Relative NAD+ levels in HSMMs after 24-h trigonelline or NR treatment, with or without 2-OHNA co-treatment (one-way ANOVA, n = 12 biological replicates per group). g–j, NAD+ metabolites measured using LC–HRMS in HSMMs (NAD+, g; NAAD, h; NAMN, i; NA, j) after 24-h incubation with trigonelline in co-treatment with FK866, 2-OHNA or their combination (one-way ANOVA, n = 3 biological replicates per group). k, Quantitative PCR (qPCR) mRNA expression of Naprt in the liver of wild-type (WT) and Naprt knockout (KO) mice (one-way ANOVA, n = 4–6 animals per group). l–n, LC–HRMS measurement of NA (l) and NAMN (m) levels in the blood and liver, and of NAAD (n) in liver 2 h after trigonelline gavage in WT or Naprt KO mice (one-way ANOVA, n = 4–6 animals per group). o, Relative NAD+ levels in HSMMs after 72 h trigonelline or NR treatment, with or without co-treatment with FK866, 2-OHNA or their combination (one-way ANOVA, n = 10 biological replicates per group). p, Mitochondrial membrane potential (ΔΨm) measured using JC-1 staining in HSMMs treated as in o (one-way ANOVA, n = 16 biological replicates per group). q, Maximum oxygen consumption rate (OCR) in HSMMs treated as in o after stimulation with 3 μM carbonyl cyanide-p-trifluoromethoxyphenylhydrazone (one-way ANOVA, n = 9–10 biological replicates per group). All data are expressed as the mean ± s.e.m with *P < 0.05, **P < 0.01, ***P < 0.001, ****P < 0.0001. NS, not significant. Individual P values are reported in Fig. 2 of the Source data. a.u., arbitrary units.

