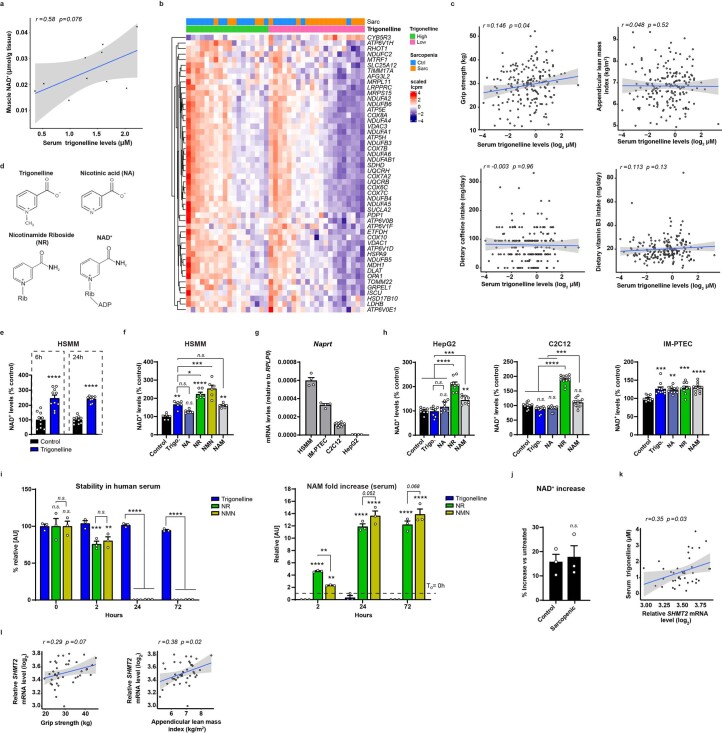
Extended Data Fig. 1. Trigonelline increases NAD+ in mammalian cells and its serum levels correlate with muscle NAD+ and Oxphos signatures in humans.
a, Correlation of serum trigonelline levels with muscle NAD+, (n = 10 validation muscle samples remaining from the MEMOSA SSS cohort). b, Heatmap showing the top 50 oxidative phosphorylation genes associated with serum trigonelline levels. c, Correlation analysis of serum trigonelline levels with appendicular lean mass (ALM) index, grip strength, dietary caffeine and vitamin B3 intake in a replication cohort; Pearson correlation coefficient and its p-value were calculated on n = 186 serum samples from the Bushehr elderly health cohort. d, Molecular structures of nicotinic acid or niacin (NA), trigonelline which differs from NA only for the methyl group, and the ribosylated (rib) molecules nicotinamide riboside (NR) and NAD+. e, NAD+ levels relative to untreated cells measured in HSMM with or without trigonelline for 6 hours or 24 hours (unpaired two-tailed Student’s t-test, mean ± s.e.m, n = 10 biological replicates per group). f, NAD+ levels relative to untreated control measured in HSMM myotubes following 24 h NAD+ precursors treatment at 1 mM (One-way ANOVA; mean ± s.e.m, n = 6 biological replicates per group). g, Naprt mRNA expression in the indicated cell lines (n = 4–12 biological replicates per group). h, NAD+ levels relative to untreated control measured in HepG2, C2C12 and IM-PTECs cells following 24 h NAD+ precursors treatment (One-way ANOVA; mean ± s.e.m, n = 8–12 biological replicates per group). i, Stability assessment of trigonelline, NR and NMN added at 1 mM in human serum and incubated at 37 °C for the indicated durations (Two-way ANOVA; mean ± s.e.m, n = 3 biological replicates per group). j, Percentage increase in NAD+ levels in trigonelline treated primary myotubes from healthy control and sarcopenic HSSe subjects relative to untreated cells (unpaired two-tailed Student’s t-test, mean ± s.e.m, n = 3 biological replicates per group). k, Correlation analysis of serum trigonelline levels with SHMT2 mRNA levels in muscle biopsies from the SSS cohort; Pearson correlation coefficient and its p-value were calculated on n = 39 serum samples. l, Correlation analysis of SHMT2 gene expression in muscle biopsies with grip strength and appendicular lean mass index in the SSS cohort; Pearson correlation coefficient and its p-value were calculated on n = 40 serum samples. P: <0.05 (*); < 0.01 (**); < 0.001 (***); < 0.0001 (****); n.s., non-significant. For all the individual p values, see the Extended Data Fig. 1 Source file.

