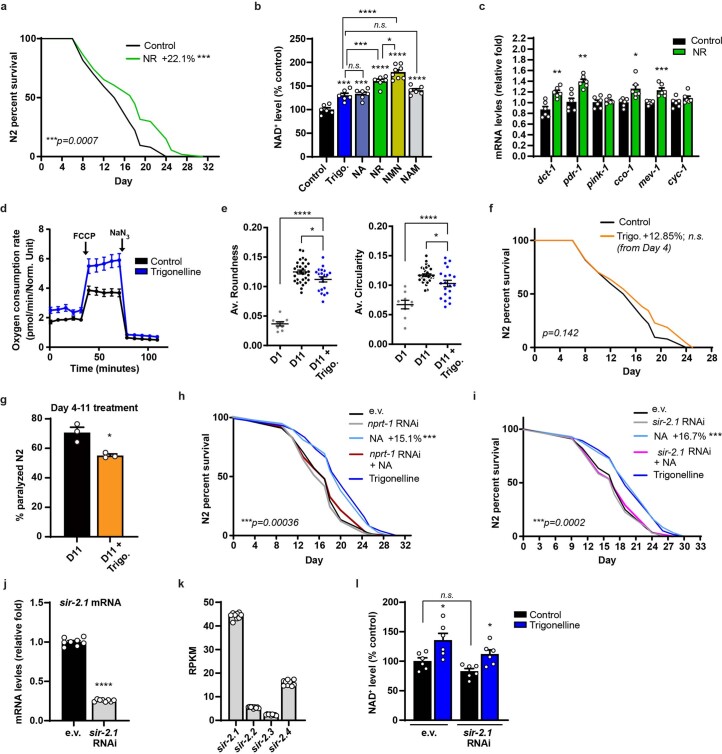
Extended Data Fig. 3. Effects of the NAD+ boosters trigonelline, NR and NA on nematode phenotypes.
a, Lifespan assessment in N2 worms treated with or without NR as designed in Fig. 2a (log-rank test, n = 90 animals per group). b, NAD+ levels (% control) in D1 adult N2 worms treated with NAD+ precursors from embryo stage (One-way ANOVA, mean ± s.e.m, n = 6–8 biological replicates per group). c, mRNA levels by qPCR of genes regulating mitochondrial function in N2 worms treated with NR from Day 1 to Day 2 of adulthood (unpaired two-tailed Student’s t-test, mean ± s.e.m, n = 6 biological replicates per group). d, Seahorse-based oxygen consumption of L4 stage N2 worms from the Fig. 3f. e, Additional integrity scoring parameters of GFP-labeled muscle fibers in the worms from the Fig. 3g (One-way ANOVA, mean ± s.e.m, n = 6 animals, 9–31 sarcomeres per group). f, Lifespan of N2 worms treated with vehicle or trigonelline starting from Day 4 of adulthood (log-rank test, n = 90 animals per group). g, Percentage of paralyzed aged N2 worms (D11=Day 11) after vehicle or trigonelline treatment started at Day 4 of adulthood (n = 3 independent experiments, unpaired two-tailed Student’s t-test, mean ± s.e.m). h, Lifespan in N2 worms treated with or without NA or trigonelline and fed with control (empty vector; e.v.) or nrpt-1 RNAi constructs from Day 1 of adulthood (comparing NA-treated worms to e.v., log-rank test, n = 100 animals per group). i, Lifespan in N2 worms treated with or without NA or trigonelline and fed with control (e.v.) or sir-2.1 RNAi from Day 1 of adulthood (comparing NA-treated worms to e.v., log-rank test, n = 100 animals per group). j, sir-2.1 mRNA levels by qPCR in D1 adult N2 worms fed with control (e.v.) or sir-2.1 RNAi from embryo stage (unpaired two-tailed Student’s t-test, mean ± s.e.m, n = 8 biological replicates per group). k, sirtuin mRNA levels in N2 worms from publicly available RNA seq data44 (n = 9 replicates per group). l, NAD+ levels (% control) in D1 adult N2 worms treated with trigonelline from embryo stage and fed with control (e.v.) or sir-2.1 RNAi constructs (One-way ANOVA, mean ± s.e.m, n = 6 biological replicates per group). P: <0.05 (*); < 0.01 (**); < 0.001 (***); < 0.0001 (****); n.s., non-significant. For all the individual p values, see the Extended Data Fig. 3 Source file.

