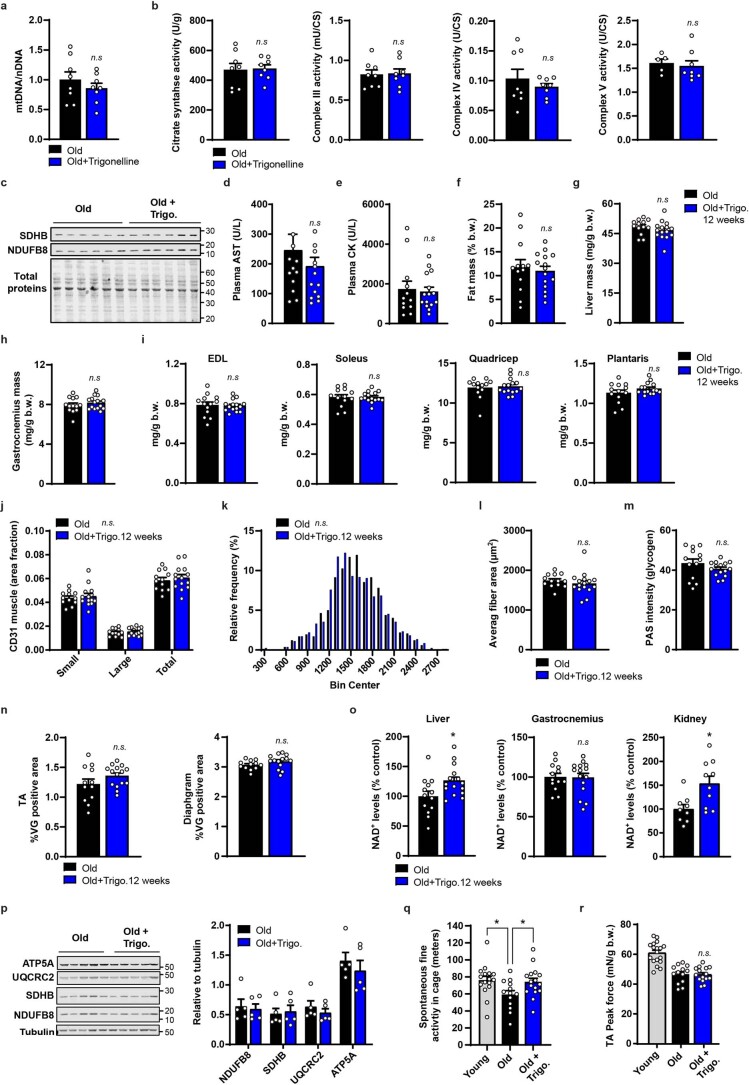
Extended Data Fig. 4. Effects of chronic trigonelline supplementation on physiological and muscle molecular readouts during aging.
a, mt/nDNA of gastrocnemius muscle of aged C57BL/6J mice (20 months) following a 5 day diet supplementation of trigonelline (unpaired two-tailed Student’s t-test, mean ± s.e.m, n = 8 animals per group), related to Fig. 4a–d. b, Citrate synthase activity and additional enzymatic activity of Oxphos subunits from gastrocnemius muscles of the same groups as in (a) (unpaired two-tailed Student’s t-test, mean ± s.e.m, n = 8 animals per group, 3 samples in control group for complex V analyses could not be measured). c, Western blot of SDHB and NDFUB8 Oxphos subunits, and Licor staining for total proteins, quantified in Fig. 4b, d. d,e Plasma aspartate aminotransferase (AST) and creatine kinase levels measured in aged C57BL/6J mice (22–24 months) after a 12 week trigonelline supplementation (unpaired two-tailed Student’s t-test, mean ± s.e.m, n = 13 and 15 animals per group), related to Fig. 4e–j. f, Fat mass composition at the end of the intervention study normalized to body weight in the same groups as in (d) (unpaired two-tailed Student’s t-test, mean ± s.e.m, n = 13 and 15 animals per group). g, Liver mass at the end of the study normalized to body weight (unpaired two-tailed Student’s t-test, mean ± s.e.m, n = 13 and 15 animals per group). h-i, Muscle mass of additional muscles at the end of the study normalized to body weight (unpaired two-tailed Student’s t-test, mean ± s.e.m, n = 13 and 15 animals per group). j, Quantification of vascularization via CD31 immunostaining in TA muscle of the control and trigonelline-treated old mice (One-way ANOVA; mean ± s.e.m, n = 12 and 14 animals per group). k, Fiber size distribution in TA muscle of the same groups, with an average of 1543 ± 13 µm2 for trigonelline treated group and 1575 ± 13 µm2 for control group (Kolmogorov-Smirnov test, n = 13 and 16 animals per group). l, Average fiber area of TA muscle quantified in the same groups (unpaired two-tailed Student’s t-test, mean ± s.e.m, n = 13 and 16 animals per group). m, Quantification of PAS glycogen staining of TA muscles of the same groups (unpaired two-tailed Student’s t-test, mean ± s.e.m, n = 12 and 15 animals per group). n, Quantification of Van Gieson (VG) fibrosis staining of TA and diaphgram muscles of the same groups (unpaired two-tailed Student’s t-test, mean ± s.e.m, n = 12 and 15 animals per group). o, NAD+ levels relative to untreated old mice measured in liver, gastrocnemius and kidney tissues after chronic trigonelline administration (unpaired two-tailed Student’s t-test, mean ± s.e.m, n = 13 and 15 biological replicates per group for liver and muscle, n = 9 and 10 biological replicates per group for kidney). p, Western blot and related quantification of Oxphos protein levels in gastrocnemius muscle of the aged control and trigonelline-treated mice (unpaired two-tailed Student’s t-test, mean ± s.e.m, n = 5 biological replicates per group). q, Spontaneous fine activity of the aged control and trigonelline-treated mice, and of the young reference group (One-way ANOVA; mean ± s.e.m, n = 13 aged animals, and 16 animals for young and trigonelline groups). r, Peak force normalized to body weight of the same groups (unpaired two-tailed Student’s t-test, mean ± s.e.m, n = 13 and 15 biological replicates per group). P: <0.05 (*); < 0.01 (**); < 0.001 (***); < 0.0001 (****); n.s., non-significant. For all the individual p values, see the Extended Data Fig. 4 Source file.

