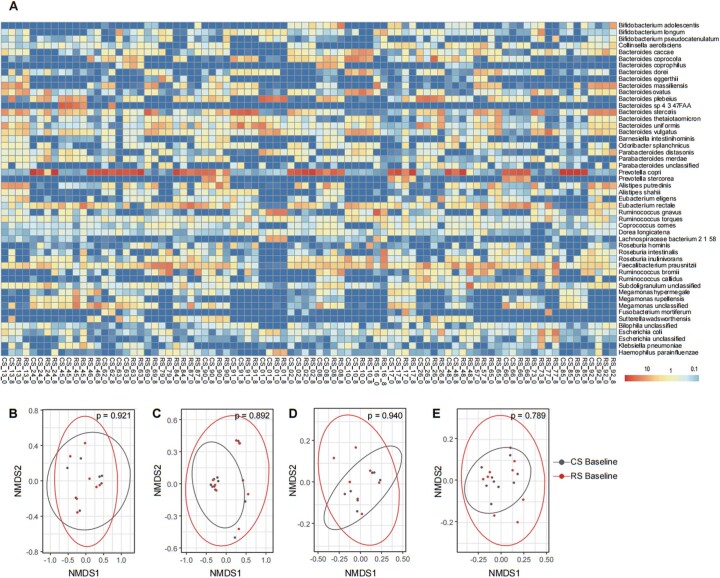
Extended Data Fig. 3. Taxonomic profile and baseline composition of the gut microbiome.
(a) The taxonomic profile of the gut microbiome at the species level for all the samples from RS and CS intervention. The samples were named using the rules of “Intervention (RS or CS) individual ID_time point (week 0 or 8). (b-e) Analysis of baseline microbial composition between RS intervention baseline and CS intervention baseline. (b) Beta-diversity for the CS-Washout-RS group using the Bray–Curtis distance method. (c) Beta-diversity for the RS-Washout-CS group using the Bray–Curtis distance method. (d) Beta-diversity for the CS-Washout-RS group using the weighted-Unifrac distance method. (e) Beta-diversity for the RS-Washout-CS group using the weighted-Unifrac distance method. All the beta-diversity plots used Non-metric multidimensional scaling (NMDS) based on the compositional profile of the species abundance. The ANOSIM results support the baseline comparability of microbial compositions (P > 0.05).

