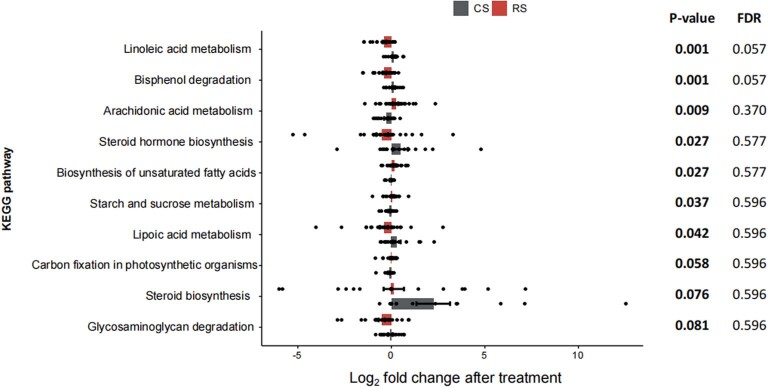
Extended Data Fig. 5. Top 10 metabolism-related KEGG pathways between RS and CS intervention.
Data are presented by the log2 fold change after treatment, which are expressed as mean ± s.e.m (27 individuals before and after RS and 16 individuals before and after CS). Statistical differences between interventions were assessed using two-sided Wilcoxon rank-sum test, with P adjusted for multiple comparisons using the Benjamini–Hochberg method.

