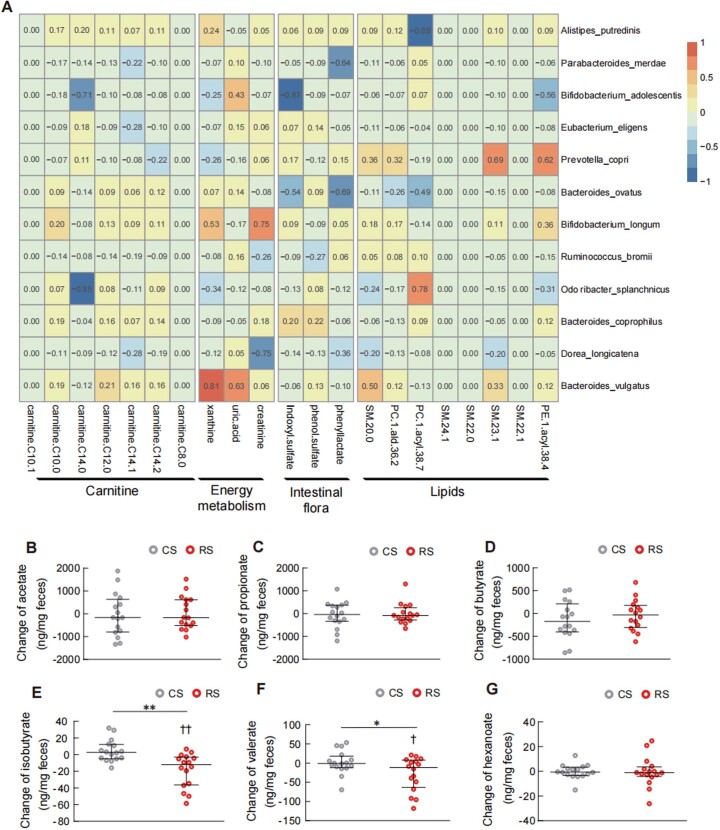
Extended Data Fig. 6. Host metabolomics in response to RS treatment.
(a) The strength of the linear correlation (model averaged Akaike information criterion [AlC] importance) between the species abundance variation (fold change after intervention) and the variation (fold change after intervention) of the circulating metabolites. The importance is the summed AlC weights of the linear models containing such variable during model selection. (b-g) Changes of faecal SCFAs after the 8-week RS or CS intervention (n = 16 individuals per group). (b) Acetate. (c) Propionate. (d) Butyrate. (e) Isobutyrate. (f) Valerate. (g) Hexanoate. Data are expressed as median with interquartile range. * P = 0.030 (f), ** P = 0.006 (e) for the difference between RS and CS intervention by linear mixed model adjusted by intervention order and † P = 0.047 (f), †† P = 0.004 (e) for the difference before and after RS intervention (RS 0W vs. RS 8W) by linear mixed model adjusted by intervention order followed by Bonferroni’s test.

