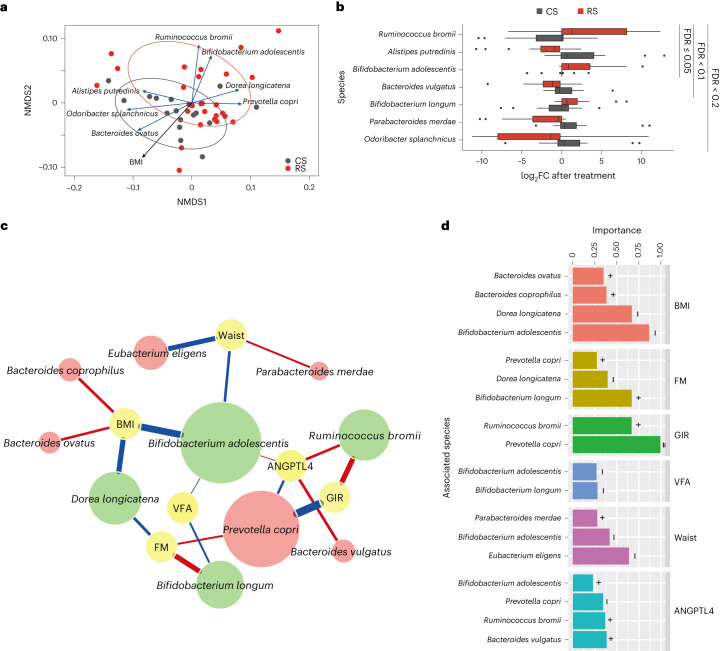
Fig. 2. The association of the gut microbiome in response to RS treatment with host phenotypes.
a, NMDS of the samples based on the variation (fold change after intervention) profile of the species abundance. The red and grey circles surround (with 95% CI) RS and CS samples, respectively. The species and phenotypes correlated with the overall ordination significantly (FDR adjusted P < 0.01 with the envfit function in VEGAN R package) are highlighted with arrows (blue, species; black, phenotype) where the length of the arrows reflects the strength of the association. b, Seven species with significantly different variation profiles (P < 0.05, BH FDR < 0.2 with paired two-sided Wilcoxon signed-rank test) between the RS and CS interventions. Box-plots indicate the median and IQR. Whiskers extend to 1.5 × IQR. c, The association network between gut microbes and the host phenotypes. A total of 12 species with different variations (P < 0.05, BH FDR < 0.3 with two-sided Wilcoxon rank-sum test) between the RS and CS groups were used as predictors in the regression model. Node colour reflects either the phenotype (yellow), species with increased abundance (green) or species with decreased abundance (red) in response to RS. The colour of the connecting line reflects either the positive correlation (red) or negative correlation (blue) between microbes and the phenotypes. The width of the connecting line reflects the strength of the statistical linear correlation (model averaged importance) between the abundance variation (fold change after intervention) and the variation of the phenotypes (fold change after intervention). The importance is the summed AIC weights of the generalized linear models containing such variables during model selection. The node size of the species reflects its overall influence on all the phenotypes. d, Summary of the importance of the associated species for each phenotype. In a–d, 27 individuals before and after RS and 16 individuals before and after CS were randomly selected from all participants for metagenomic analysis.

