Figure 2.

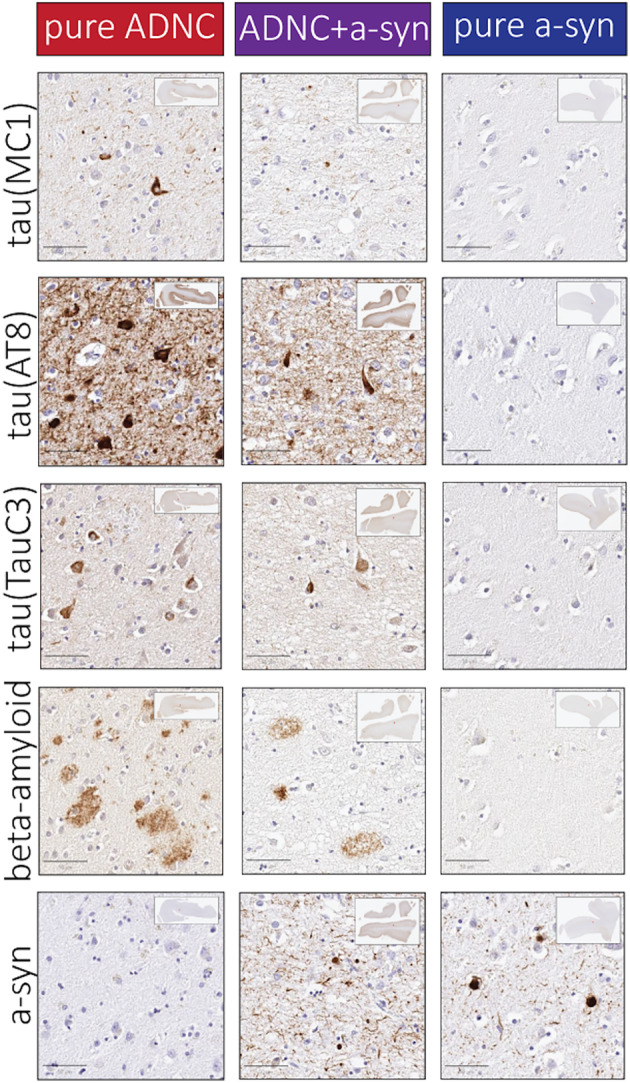
Representative photomicrographs. Photomicrographs from layer V in superior/middle temporal cortex are shown in individuals with either pure ADNC, ADNC+a‐syn, or pure a‐syn groups, respectively. Scale bar: 50 μm.

Representative photomicrographs. Photomicrographs from layer V in superior/middle temporal cortex are shown in individuals with either pure ADNC, ADNC+a‐syn, or pure a‐syn groups, respectively. Scale bar: 50 μm.