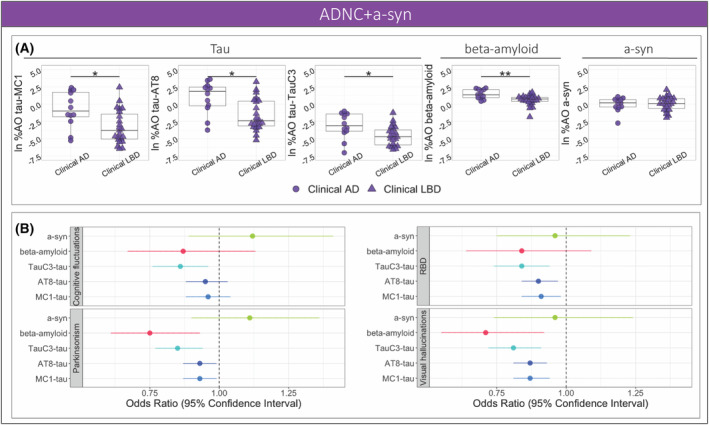
Figure 5.

Clinical correlates of pathologies the ADNC+a‐syn group. (A) Percent area‐occupied (%AO) was compared between the clinical groups of AD and LBD with mixed ADNC+a‐syn pathology for MC1‐, AT8‐, and TauC3‐immunoreactive tau, beta‐amyloid, and a‐syn. (B) The forest plot illustrates the odds ratio and 95% confidence intervals for the association between pathologies and core clinical features of dementia with Lewy bodies based on logistic regression models; shape indicates clinical syndrome (***p‐value < 0.001, **p‐value < 0.01, *p‐value < 0.05).
