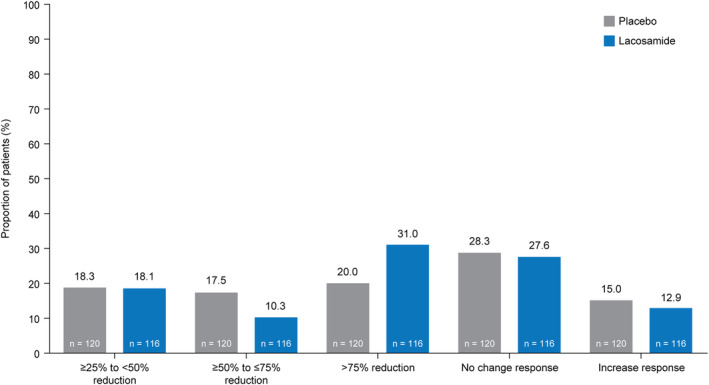
Figure 4.

Proportion of patients who experienced a reduction, no change response, or increase response in ADF of electrographic focal seizures from the EOB to the EOMa (full analysis set). ADF, average daily frequency; EEG, electroencephalogram; EOB, end‐of‐baseline period; EOM, end‐of‐maintenance period. aPercentages were based on the number of patients in the full analysis set who had ≥48 h of interpretable recording during both the EOB and the EOM video‐EEGs. A ≥25% to <50% response was defined as a ≥25% to <50% reduction in ADF of electrographic focal seizures from the EOB video‐EEG to the EOM video‐EEG. A ≥50% to ≤75% response was defined as a ≥50% to ≤75% reduction in ADF of electrographic focal seizures from the EOB video‐EEG to the EOM video‐EEG. A >75% response was defined as a >75% reduction in ADF of electrographic focal seizures from the EOB video‐EEG to the EOM video‐EEG. No change was defined as between a <25% reduction and <25% increase in ADF of electrographic focal seizures from the EOB video‐EEG to the EOM video‐EEG. An increase was defined as a ≥25% increase in ADF of electrographic focal seizures from the EOB video‐EEG to the EOM video‐EEG.
