Figure 1.

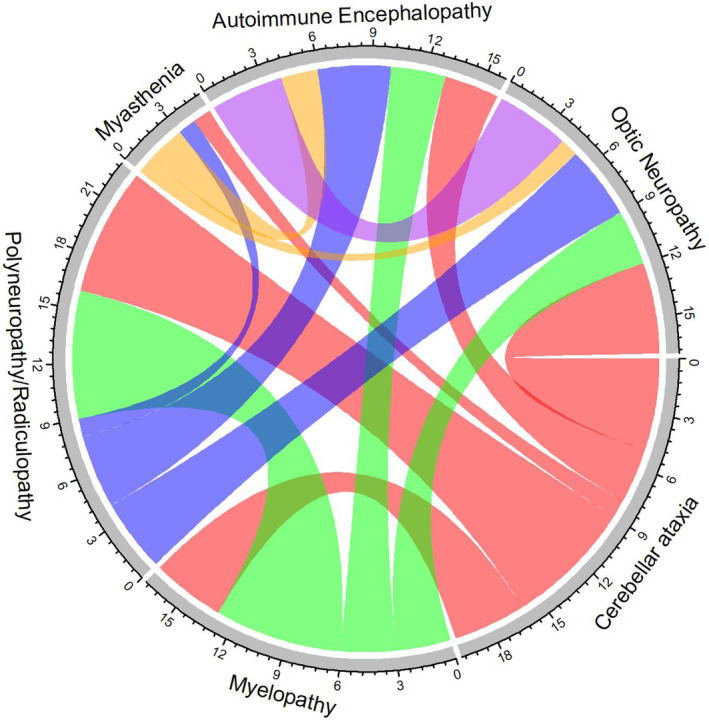
Chord diagram showing overlapping neurologic phenotypes. The size of the arc connecting two phenotypes indicates the number of patients who had both phenotypes.

Chord diagram showing overlapping neurologic phenotypes. The size of the arc connecting two phenotypes indicates the number of patients who had both phenotypes.