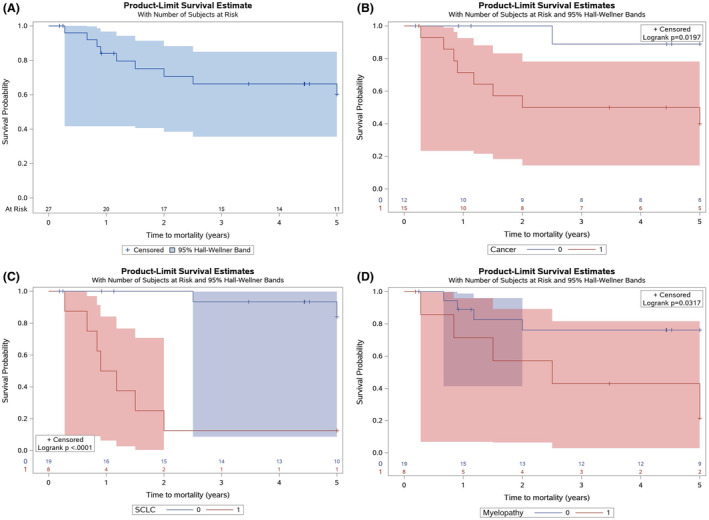
Figure 4.

(A) Kaplan–Meier curve for time to mortality. (B) Kaplan–Meier curve for time to mortality, stratified by cancer (yes/no). (C) Kaplan–Meier curve for time to mortality, stratified by small cell lung cancer (yes/no). (D) Kaplan–Meier curve for time to mortality, stratified by myelopathy (yes/no).
