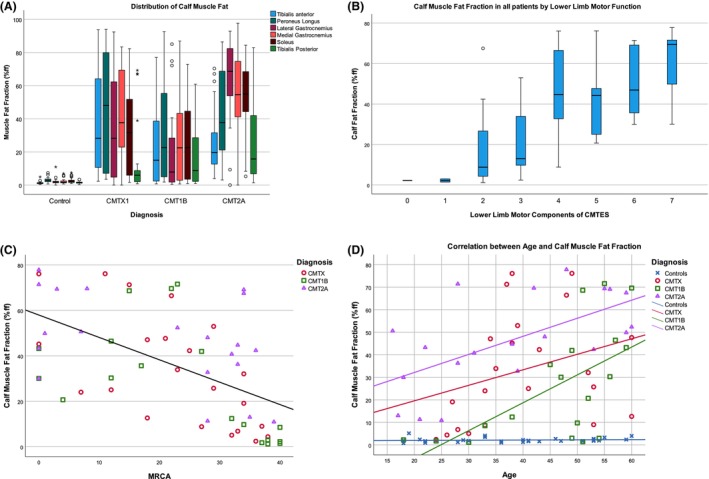
Figure 2.

Cross‐sectional MRI‐clinical correlations. (A) Box and whisker plot of muscle fat fraction in right calf muscles by disease group. All 30 control subjects are grouped in this plot. (B) Box and whisker plot of mean calf muscle fat fraction in patients grouped by their lower limb motor components of CMTESv2. Box and whiskers represent median/IQR/range with circled minor outliers and asterisked major outliers. (C) Inverse correlation between calf muscle fat fraction and total ankle MRC grade by disease group (sum ankle plantarflexion, dorsiflexion, inversion, eversion bilaterally and maximum score 40). (D) Correlation between calf muscle fat fraction and age in disease groups and controls.
