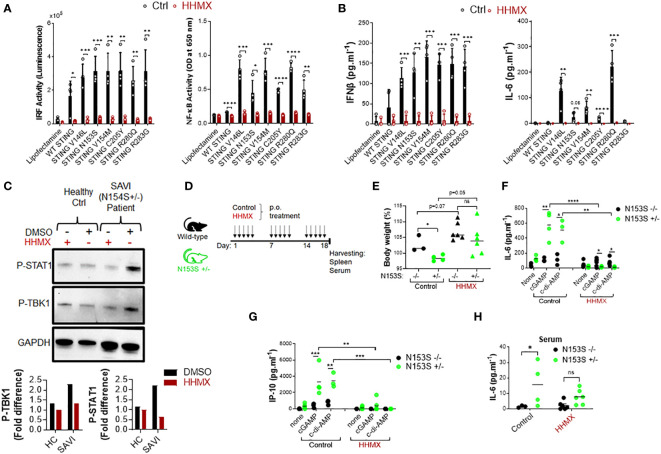
Figure 5.
HHMX shows therapeutic potential against the STING-mediated autoinflammatory disease SAVI. (A) J774 dual reporter cells were transfected with the plasmids expressing WT STING or STING containing V146L, N153S, V154M, C205Y, R280Q, or R283G mutations together with HHMX (10 µg/ml) co-stimulation for 24 h in four independent experiments. IRF activity was determined by measuring secreted luciferase activity in the supernatants. NF-κB activity was determined by measuring secreted embryonic alkaline phosphatase (SEAP) activity in the supernatant. Data are shown as the mean ± SD of four independent experiments (n=4, biological replicates) (*p < 0.05, **p < 0.01, ***p < 0.001, ****p < 0.0001, Student’s t test.). (B) The concentrations of IFNβ and IL-6 in the supernatants were measured using ELISA. Data are shown as the mean ± SD of four independent experiments (n=4, biological replicates) (**p < 0.01, ***p < 0.001, ****p < 0.0001, Student’s t test.). (C) Fresh human PBMCs isolated from a healthy donor or SAVI patient bearing heterozygous STING N154S mutation were treated with HHMX (30 µg/ml) for 24 h and after protein isolation; the phosphorylation of TBK1 and STAT1 was investigated using western blotting. Graphs showing the band quantifications for P-TBK1 and P-STAT1 after normalization to GAPDH were plotted. (D) Eight–to-thirteen-week-old N153S+/- SAVI mice (n=4-6) and their WT littermate (n=3-6) controls were orally administered 500 µg of HHMX or control, respectively, for 3 weeks every weekday (5 times/week). (E) Body weight and symptoms of mice were monitored until the day of sacrifice. Body weight percentage on day 18 are shown as dot plots with mean values (*p < 0.05, Student’s t test). (F, G) Splenocytes isolated from the control or HHMX treatment mice were stimulated with cGAMP and c-di-AMP for 24 h and the supernatant (F) IL-6 and (G) IP-10 levels were measured using ELISA. Data is the representative of two independent experiments and individual data from each mouse are shown (*p < 0.05, **p < 0.01, ***p < 0.001, ****p < 0.0001, Student’s t test). (H) The serum IL-6 levels of the HHMX-treated or control mice were measured using ELISA with the serum samples taken on the day of sacrifice. Data is the representative of two independent experiments and individual data from each mouse are shown (*p < 0.05, Student’s t test).

