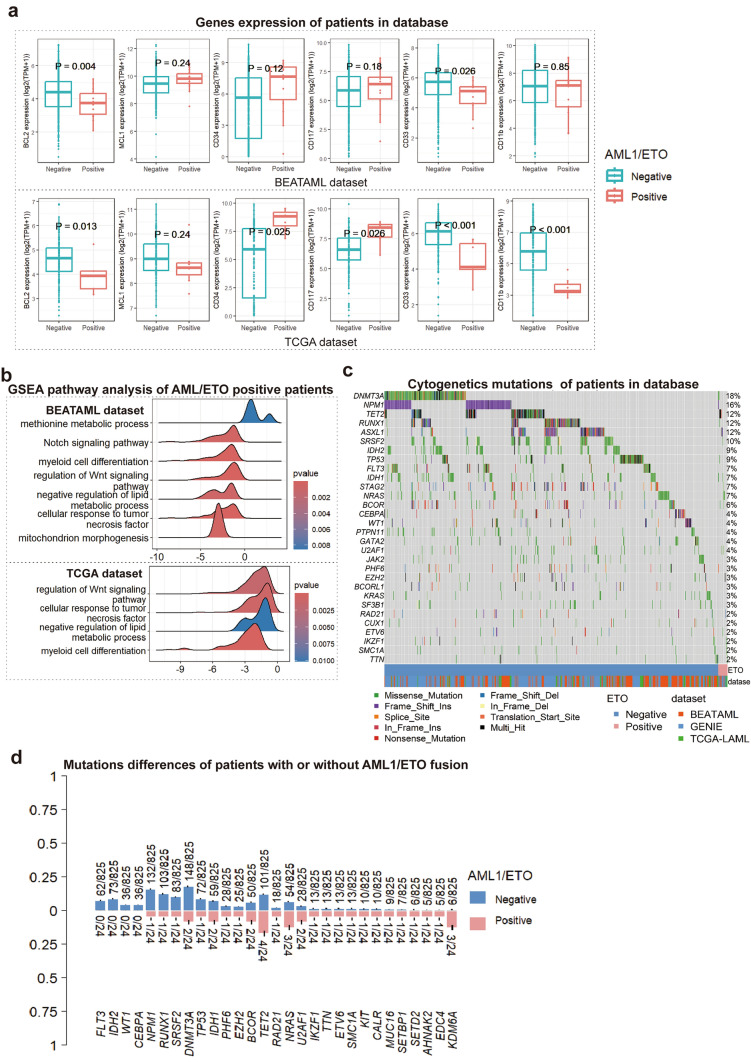
Fig. 5.
Different gene expressing analysis, pathway analysis, and SNV analysis of AML patients in datasets. a BCL2 expression between AML patients with and without AML1/ETO fusion. Expression was in logarithm. p-Value was calculated by DESeq2. b Pathway enrichment result. X axis value presented the quantitative results of pathway enrichment. Down-regulated pathways were at the left side of zero. c Gene mutations and d mutation abundance of AML patients with and without AML1/ETO fusion. AML acute myeloid leukemia, GSEA gene set enrichment analysis, SNV simple nucleotide variation

