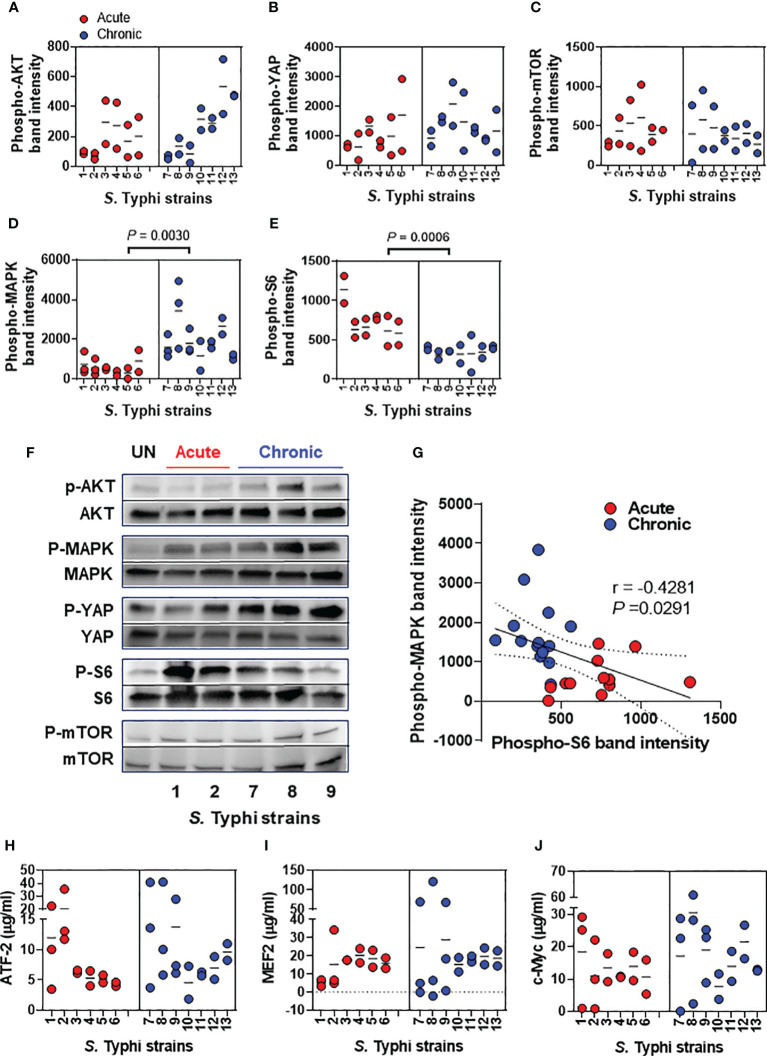
Figure 2.
Salmonella modulation of gallbladder epithelial cell molecular pathways. Epithelial cells from HODGM model were exposed to 13 S. Typhi strains isolated from acutely infected (n=6,  ) or chronically (n=7,
  ) infected individuals. HODGM models cultured with media only were used as negative controls. After 5 hours, the cells were harvested, lysed, and phosphorylation of (A) AKT, (B) YAP, (C) mTOR, (D) MAPK, and (E) S6 were detected by western blot. Data are representative of the net responses observed in at least 4 experiments. Net responses were calculated by subtracting the responses of the controls (media) from those in cells exposed to S. Typhi. Each dot is the average of 2 technical independent replicates. The density was normalized to the corresponding pan kinase. Two-tailed nested-t-tests were used to account for the repeated measures within the groups. Dotted lines represent the mean responses. (F) Shown is a representative immunoblot analysis of protein lysates. Results from uninfected media controls (UN) and acute and chronic strains are displayed (G) Correlation between phosphorylation levels of S6 and MAPK using the combined data after exposure to S. Typhi strains isolated from acutely and chronically infected individuals. The solid line represents the trendline. Dashed lines represent 95% confidence intervals. Shown are the coefficient of determination “r” and the “P” value. Correlations used the two-sided Pearson Product Moment tests. (H-J) MAPK regulated transcription factors (H) Phospho-ATF-2, (I) Phospho-MEF2, and (J) Phospho-c-Myc were detected by ELISA-based assays, TransAM assays. Data are representative of the net responses observed in 5 experiments. Net responses were calculated by subtracting the responses of the controls (media) from those in cells exposed S. Typhi. Each dot is the average of 2 technical independent replicates. Two-tailed nested-t-test was used to account for the repeated measures within the groups. P values < 0.05 were considered statistically significant. Dotted lines represent the mean responses.

