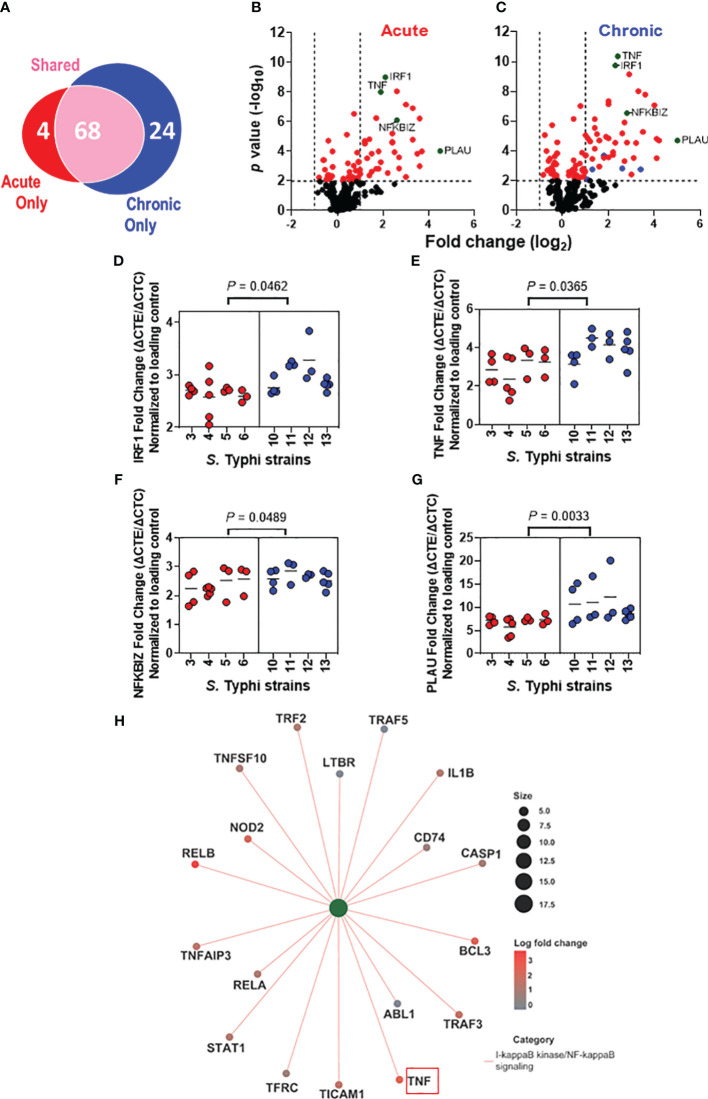
Figure 4.
Distinct alterations in the immunologically related host gene expression after exposure to S. Typhi strains derived from acutely and chronically infected patients. Epithelial cells from HODGM model were exposed to 8 S. Typhi strains isolated from acutely infected (n=4,  ) or chronically (n=4,
  ) infected individuals, and gene expression was assessed by Nanostring assay using the nCounter Human Immunology V2 profiling Panel. (A) Venn diagram showing the number of genes significantly upregulated that are unique or shared among the two S. Typhi strain groups. (B, C) Volcano plots depicting differentially expressed gene P value (-log10) as a function of fold change(log2) in HODGM models exposed to S. Typhi strains isolated from acutely (B) or chronically (C) infected individuals. Red dots (
 ) indicate P values of <0.01. Green dots (
 ) indicate genes that were significantly increased in cultures exposed to S. Typhi strains derived from chronically infected patients compared to those derived from acutely infected patients. Blue dots (
 ) indicate genes with expressions >2 fold higher than the controls that were upregulated only by the S. Typhi strains derived from chronically infected individuals. (D-G) Individual gene expression data of (D) IRF1, (E) TNF, (F) NFKBIZ, and (G) PLAU. Data are representative of 3 individual experiments. Each dot symbolizes the log2 fold change of the samples exposed to S. Typhi strains and those cultures with media only (controls). The two-tailed nested-t-test was used to account for the repeated measures within the groups. (H) Network diagram with associated data to color nodes to visualize relationships. I-kappaB kinase/NF-kappaB signaling category.

