Figure 5.
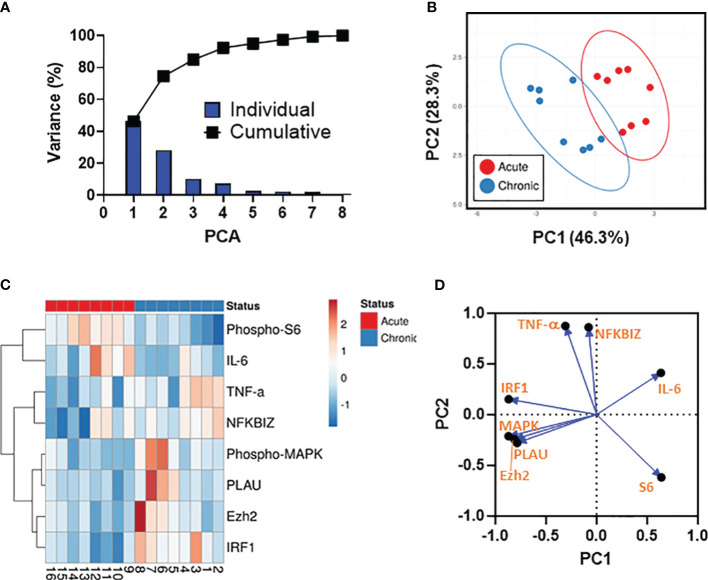
Data Integration using Principal Component Analysis (PCA). (A) The percent variation is plotted for each component (bars) and cumulatively (line). (B) PCA. Unit variance scaling is applied to rows; SVD with imputation is used to calculate principal components. X and Y axis show principal component 1 (PC1) and principal component 2 (PC2) that account for 46.3% and 28.3% of the total variance, respectively. Prediction ellipses are such that with a probability 0.95, a new observation from the same group will fall inside the ellipse. n= 16 data points. (C) Dendogram. Rows are centered; unit variance scaling is applied to rows. Rows are clustered using correlation distances and average linkages. Columns are clustered using binary distance and average linkage. 8 rows, 16 columns. (D) PCA loadings plot showing the distributions of the analytical variables.

