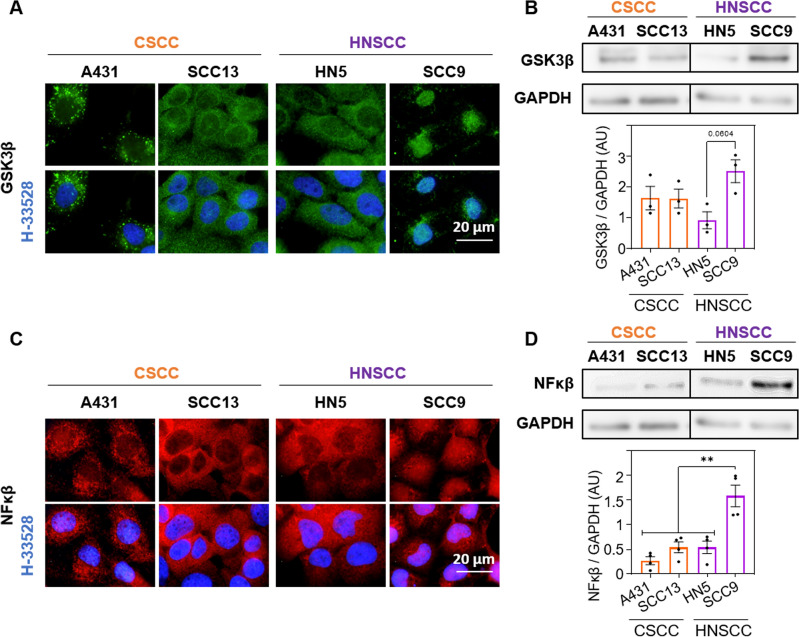
Figure 3.
GSK3β and NF-κβ expression. (A) Localization of GSK3β (green) determined by indirect immunofluorescence. Nuclei are counterstained with Höechst-33258 (blue), n = 3. (B) Quantification of GSK3β expression by Western blot. A representative band and densitometry of the bands relative to the loading control (GAPDH) are shown, n = 3. (C) Localization of NF-κβ (red) determined by indirect immunofluorescence. Nuclei are counterstained with Höechst-33258 (blue), n = 3. (D) Expression and quantification of NF-κβ by Western blot. Representative band and densitometry of these relative to the loading control (GAPDH) are shown, n = 3. Values are represented as mean ± SEM (**p < 0.01).

